9.2 Multivariate Graphing
ggplot(data = nesarc, aes(x = MajorDepression, fill = TobaccoDependence)) +
  geom_bar(position = "fill") +
  theme_bw() +
  labs(x = "", y = "Fraction", title = "Fraction of young adult daily smokers\nwith and without nicotine addiction\nby depression status") +
  scale_fill_manual(values = c("green", "red"), name = "Tobacco Addiction Status") +
  facet_grid(Sex ~ .) +
  guides(fill = guide_legend(reverse = TRUE))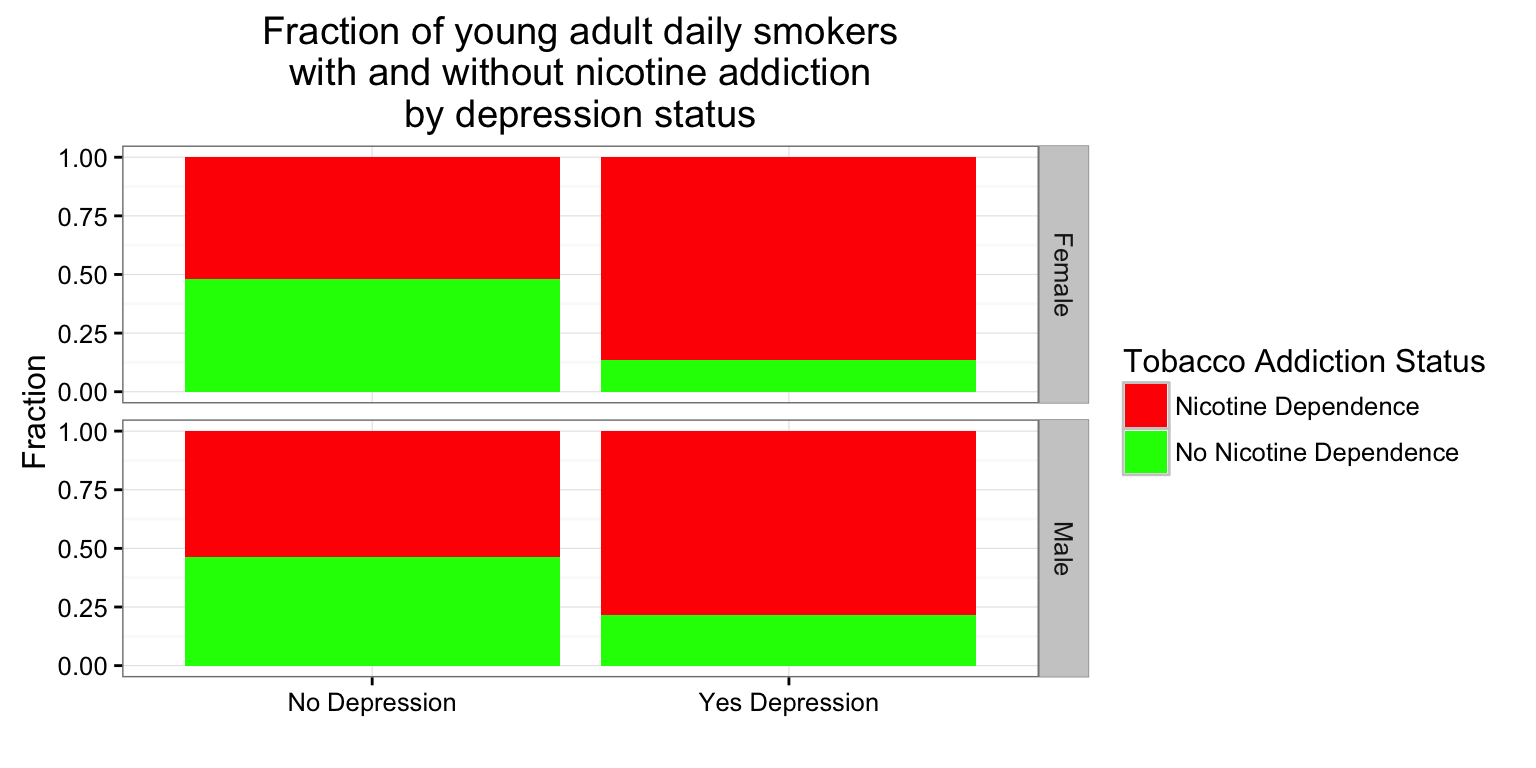
Graphs that seem to provide important information can in fact be erroneous. Please watch the COMMON GRAPHING MISTAKES VIDEO (3:35).
Bivariate Graphing Assignment
Post a graph showing the association between your explanatory and response variables (bivariate graph) on your private GitHub repository. Include a second graph of your bivariate graph by a third variable (multivariate graph). Write a few sentences describing what your graphs show.