11 Analysis of Variance6
Please watch the Chapter 11 video below.
In our description of hypothesis testing in the previous chapter, we started with case \(C \rightarrow Q\), where the explanatory variable/independent variable/predictor (\(X\) = major depression) is categorical and the response variable/dependent variable/outcome (\(Y\) = number of cigarettes smoked) is quantitative. Here is a similar example:
GPA and Year in College
Say that our variable of interest is the GPA of college students in the United States. Since GPA is quantitative, we do inference on \(\mu\), the (population) mean GPA among all U.S. college students. We are really interested in the relationship between GPA and college year:
\(X\): year in college (1 = freshmen, 2 = sophomore, 3 = junior, 4 = senior) and \(Y\): GPA
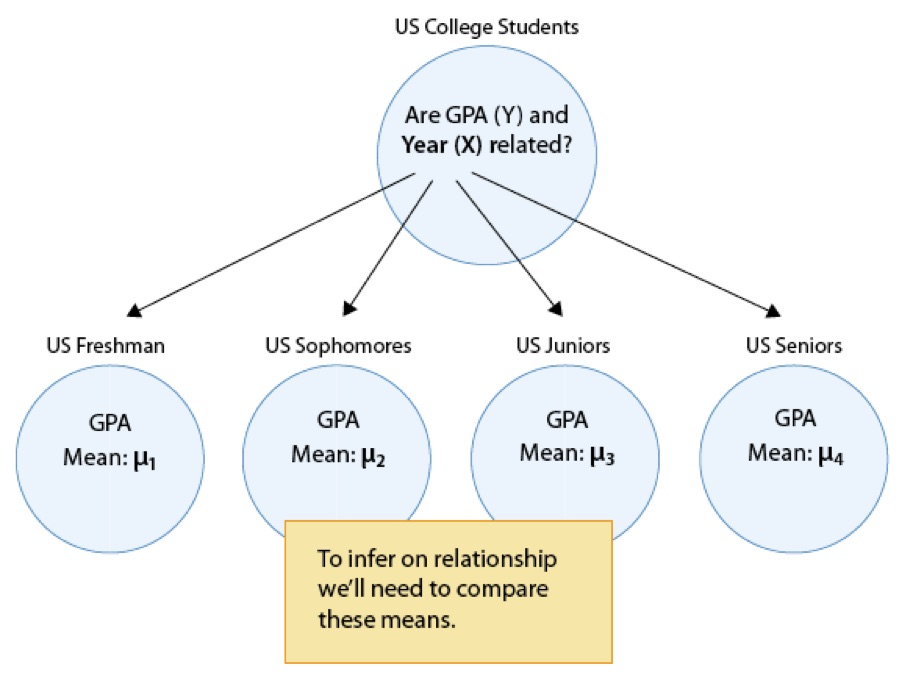
In other words, we want to explore whether GPA is related to year in college. The way to think about this is that the population of U.S. college students is now broken into 4 sub-populations: freshmen, sophomores, juniors, and seniors. Within each of these four groups, we are interested in the GPA.
The inference must therefore involve the 4 sub-population means:
- \(\mu_1\): mean GPA among freshmen in the United States
- \(\mu_2\): mean GPA among sophomores in the United States
- \(\mu_3\): mean GPA among juniors in the United States
- \(\mu_4\): mean GPA among seniors in the United States
It makes sense that the inference about the relationship between year and GPA has to be based on some kind of comparison of these four means. If we infer that these four means are not all equal (i.e., that there are some differences in GPA across years in college) then that’s equivalent to saying GPA is related to year in college. Let’s summarize this example with a figure:
In general, then, making inferences about the relationship between \(X\) and \(Y\) in Case \(C\rightarrow Q\) boils down to comparing the means of \(Y\) in the sub-populations, which are created by the categories defined in \(X\) (say \(k\) categories). The following figure summarizes this:

The inferential method for comparing means is called Analysis of Variance (abbreviated as ANOVA), and the test associated with this method is called the ANOVA F-test. We will first present our leading example, and then introduce the ANOVA F-test by going through its 4 steps, illustrating each one using the example.
Is “academic frustration” related to major?
A college dean believes that students with different majors may experience different levels of academic frustration. Random samples of size 35 of Business, English, Mathematics, and Psychology majors are asked to rate their level of academic frustration on a scale of 1 (lowest) to 20 (highest).
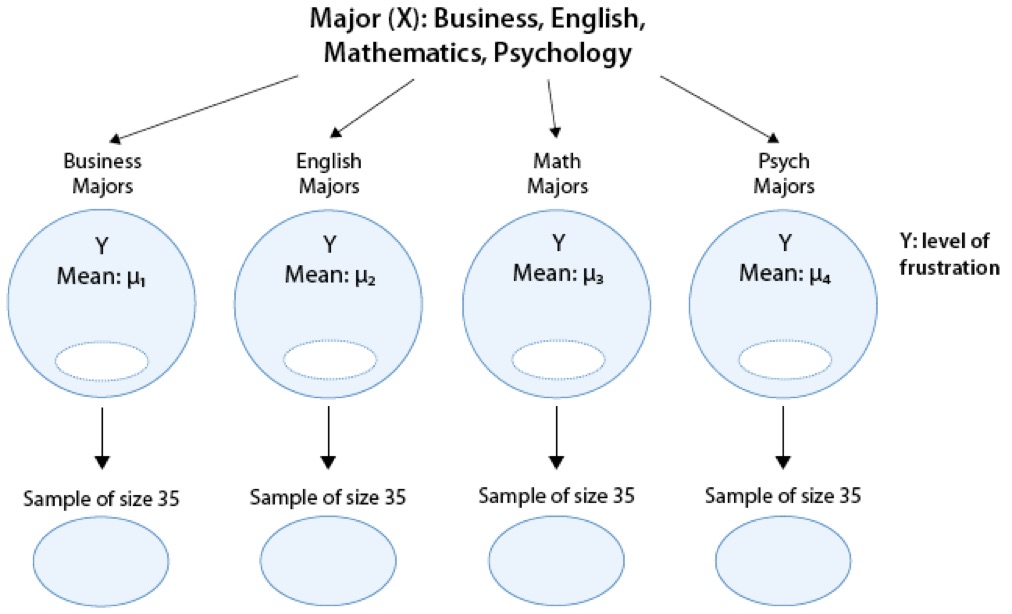
The figure highlights that examining the relationship between major (\(X\)) and frustration level (\(Y\)) amounts to comparing the mean frustration levels (\(\mu_1, \mu_2,\mu_3,\mu_4\)) among the four majors defined by \(X\).