Function creates side-by-side boxplots for each factor, a design plot (means), and an interaction plot.
twoway.plots(Y, fac1, fac2, COL = c("#A9E2FF", "#0080FF"))Arguments
- Y
response variable
- fac1
factor one
- fac2
factor two
- COL
a vector with two colors
See also
Examples
with(data = TIREWEAR, twoway.plots(wear, treat, block))
 #################################
## Similar graphs with ggplot2 ##
#################################
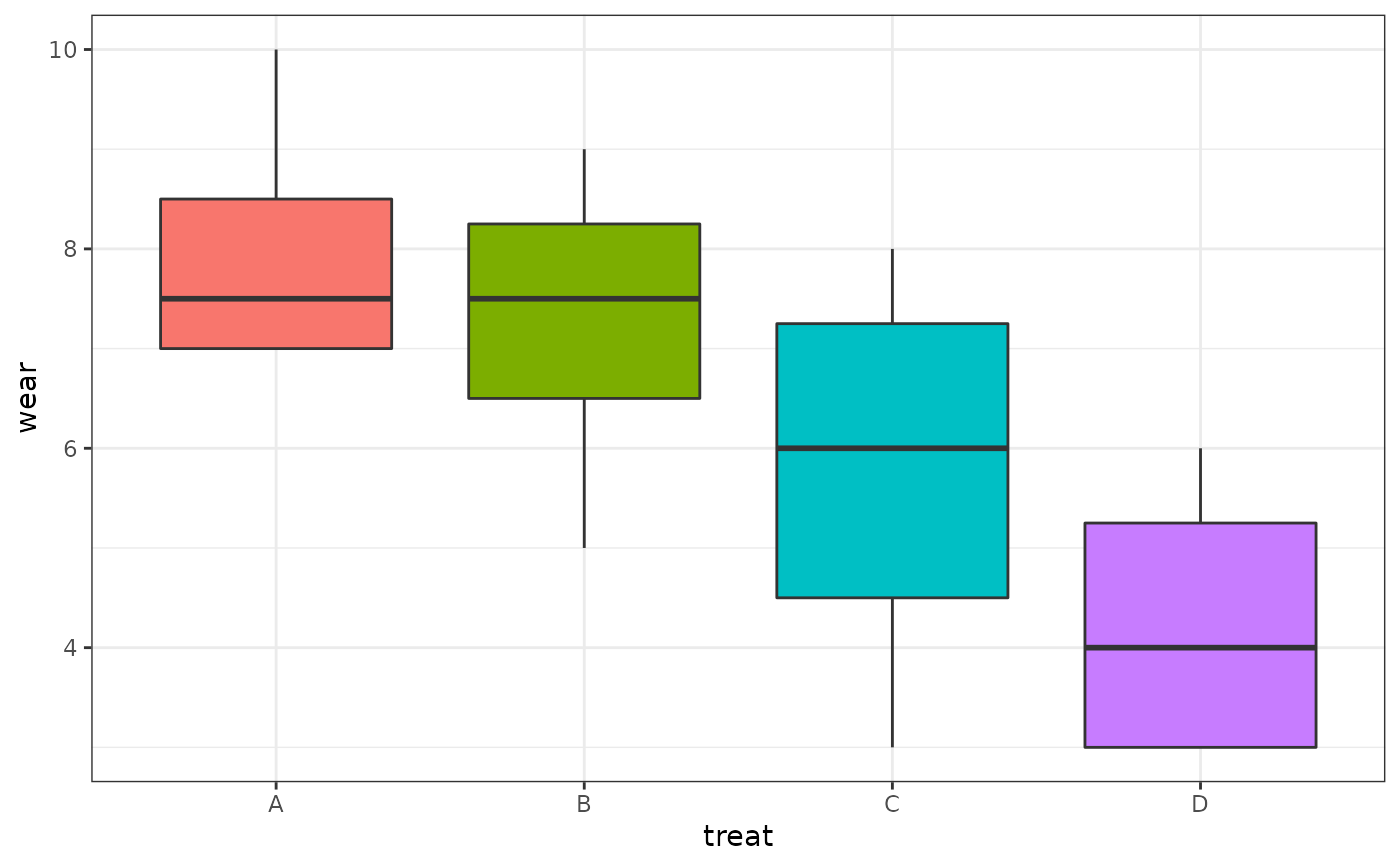
p1 <- ggplot(data = TIREWEAR, aes(x = treat, y = wear, fill = treat)) +
geom_boxplot() + guides(fill = FALSE) + theme_bw()
#> Warning: `guides(<scale> = FALSE)` is deprecated. Please use `guides(<scale> = "none")` instead.
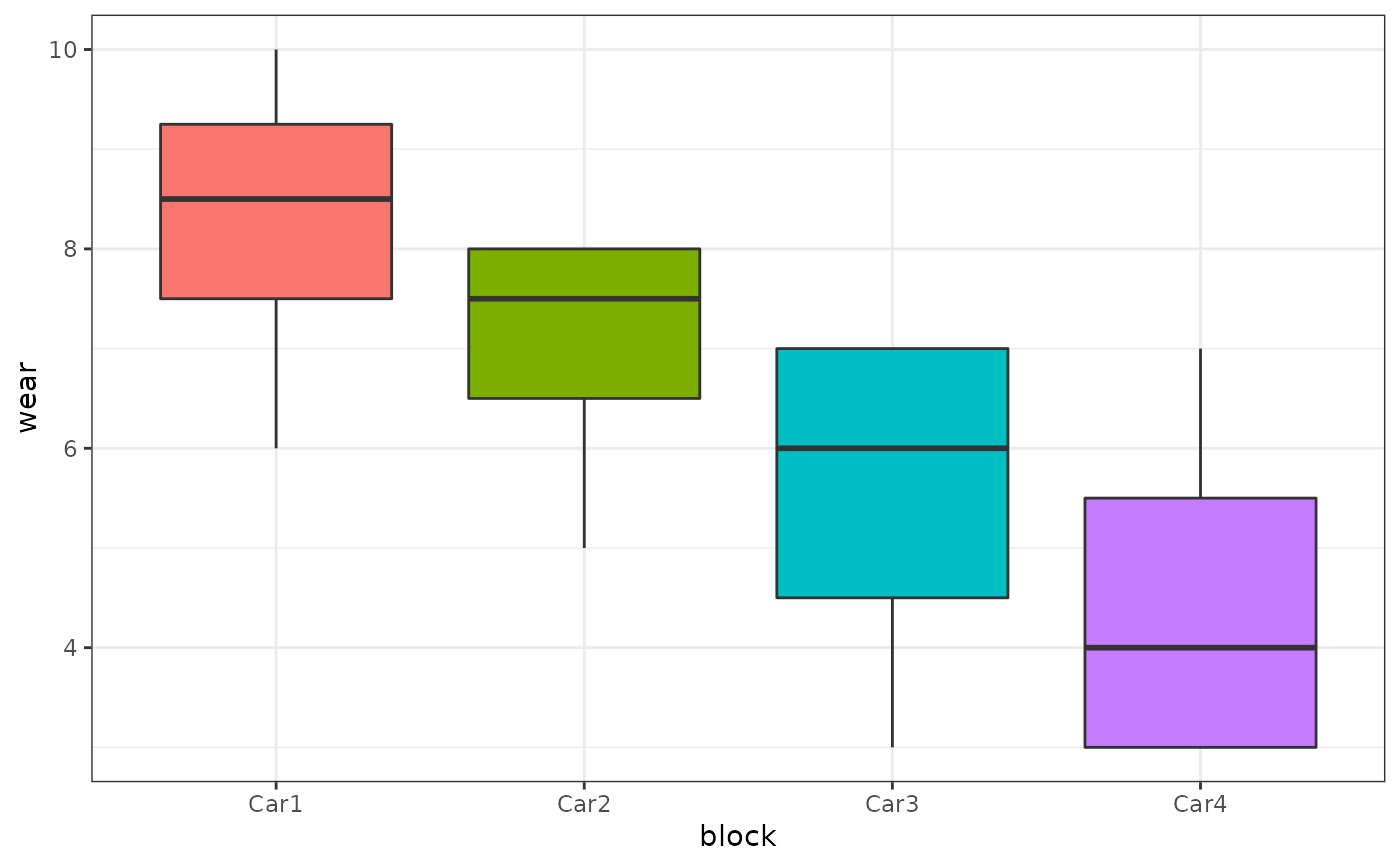
p2 <- ggplot(data = TIREWEAR, aes(x = block, y = wear, fill = block)) +
geom_boxplot() + guides(fill = FALSE) + theme_bw()
#> Warning: `guides(<scale> = FALSE)` is deprecated. Please use `guides(<scale> = "none")` instead.
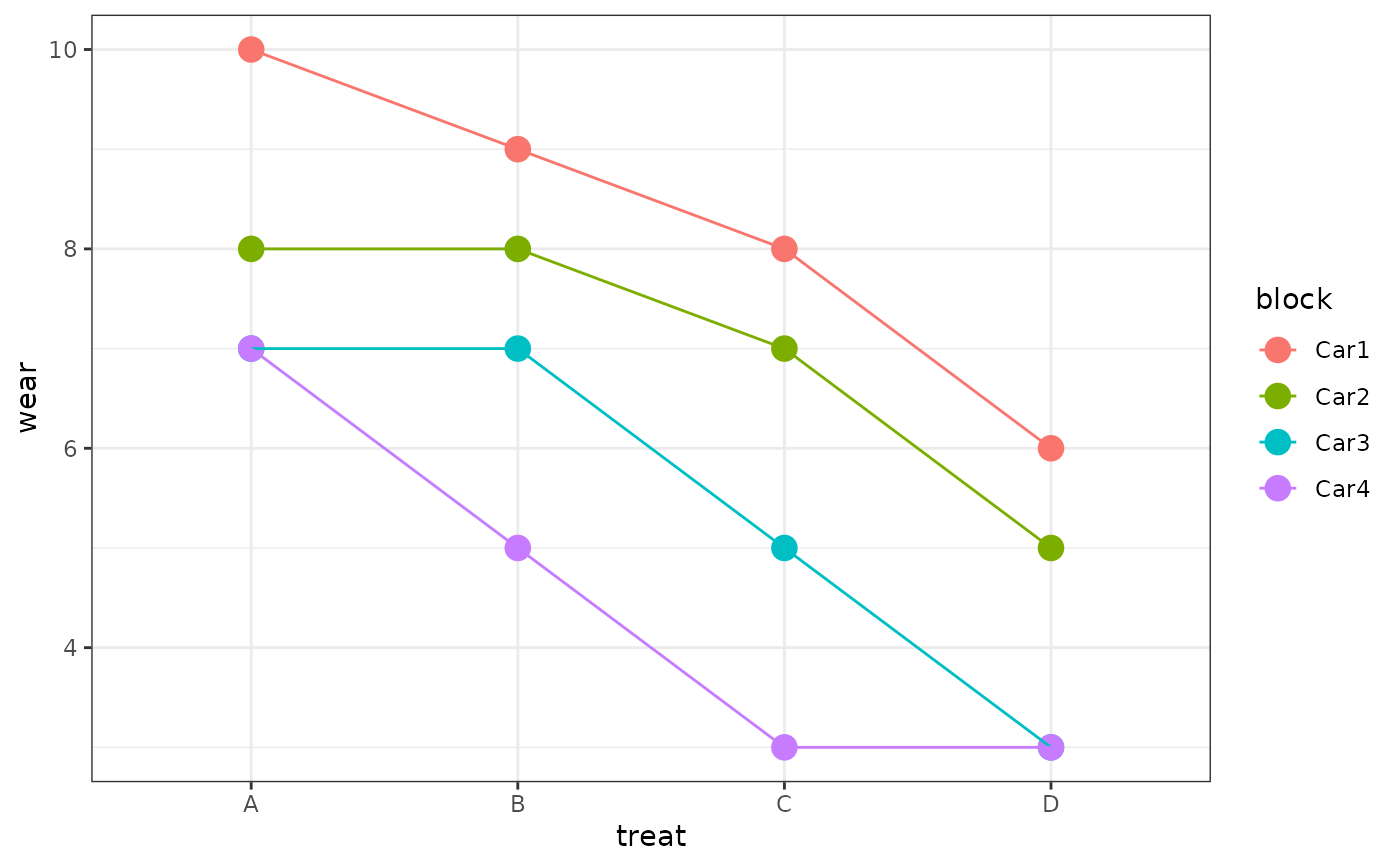
p3 <- ggplot(data = TIREWEAR, aes(x = treat, y = wear, color = block,
group = block)) + stat_summary(fun.y = mean, geom = "point", size = 4) +
stat_summary(fun.y = mean, geom = "line") + theme_bw()
#> Warning: `fun.y` is deprecated. Use `fun` instead.
#> Warning: `fun.y` is deprecated. Use `fun` instead.
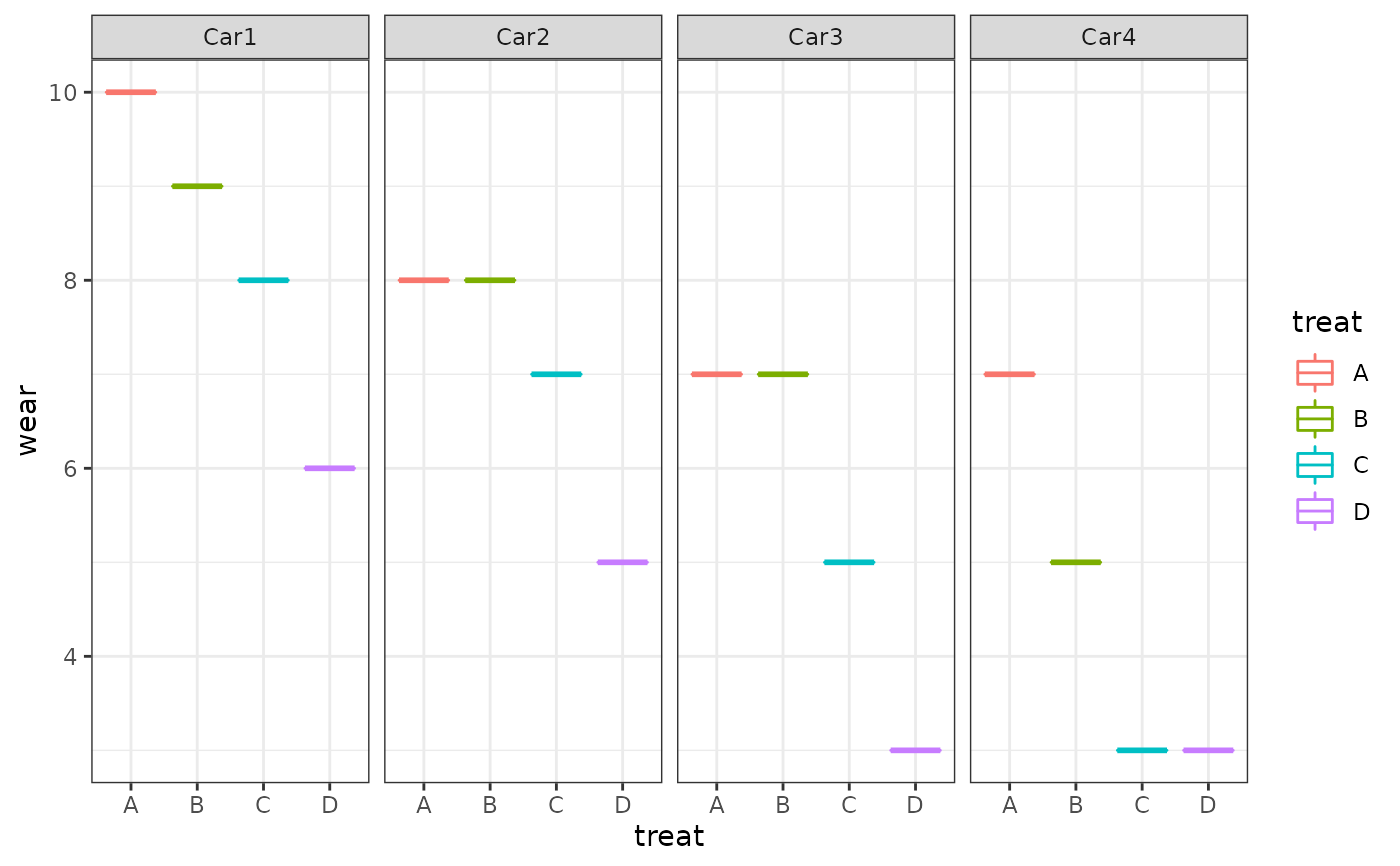
p4 <- ggplot(data = TIREWEAR, aes(x = treat, y = wear, color = treat)) +
geom_boxplot() + facet_grid(. ~ block) +theme_bw()
p1
#################################
## Similar graphs with ggplot2 ##
#################################
p1 <- ggplot(data = TIREWEAR, aes(x = treat, y = wear, fill = treat)) +
geom_boxplot() + guides(fill = FALSE) + theme_bw()
#> Warning: `guides(<scale> = FALSE)` is deprecated. Please use `guides(<scale> = "none")` instead.
p2 <- ggplot(data = TIREWEAR, aes(x = block, y = wear, fill = block)) +
geom_boxplot() + guides(fill = FALSE) + theme_bw()
#> Warning: `guides(<scale> = FALSE)` is deprecated. Please use `guides(<scale> = "none")` instead.
p3 <- ggplot(data = TIREWEAR, aes(x = treat, y = wear, color = block,
group = block)) + stat_summary(fun.y = mean, geom = "point", size = 4) +
stat_summary(fun.y = mean, geom = "line") + theme_bw()
#> Warning: `fun.y` is deprecated. Use `fun` instead.
#> Warning: `fun.y` is deprecated. Use `fun` instead.
p4 <- ggplot(data = TIREWEAR, aes(x = treat, y = wear, color = treat)) +
geom_boxplot() + facet_grid(. ~ block) +theme_bw()
p1
 p2
p2
 p3
p3
 p4
p4
 ## To get all plots on the same device use gridExtra (not run)
## library(gridExtra)
## grid.arrange(p1, p2, p3, p4, nrow=2)
## To get all plots on the same device use gridExtra (not run)
## library(gridExtra)
## grid.arrange(p1, p2, p3, p4, nrow=2)