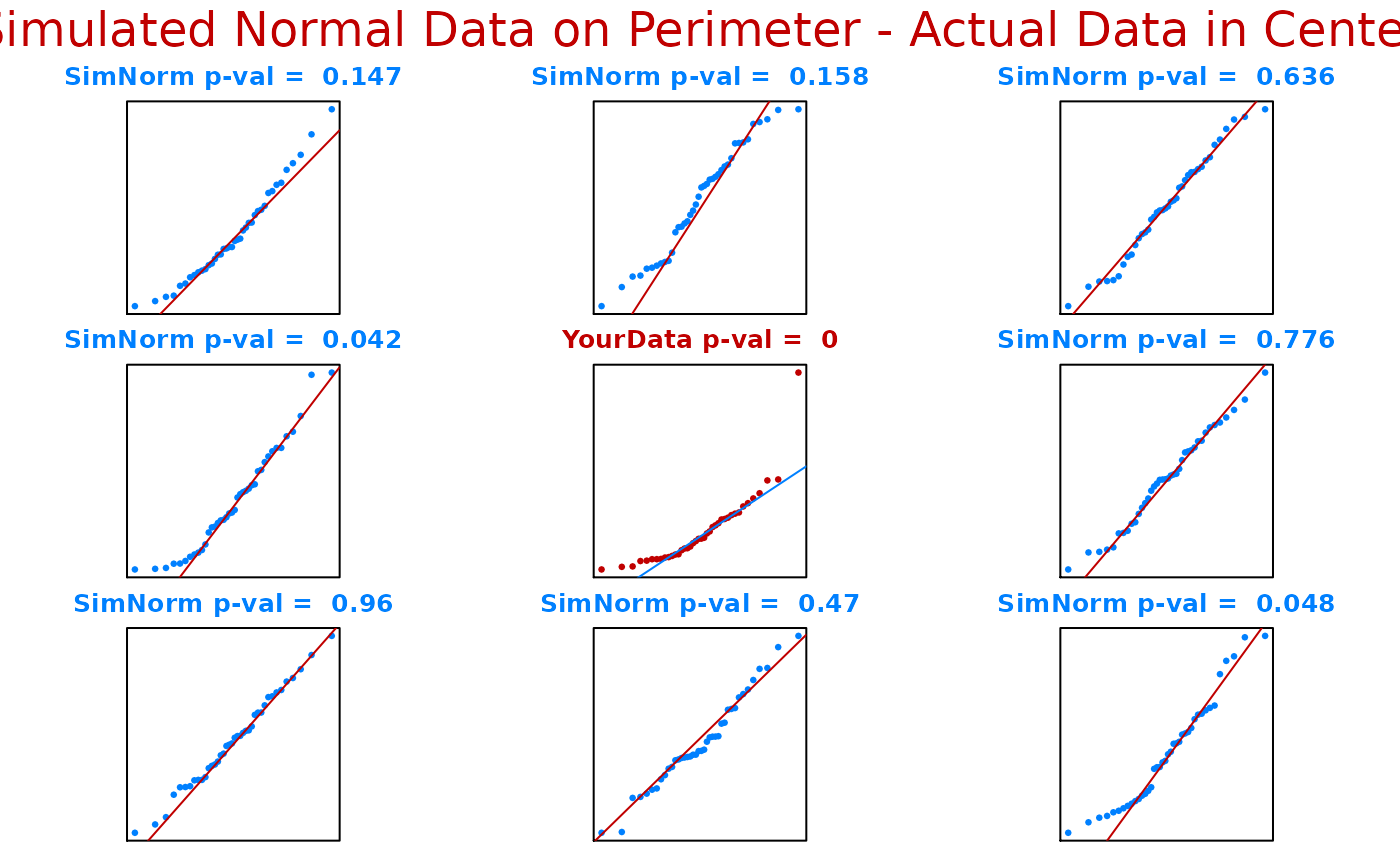
Q-Q plots of randomly generated normal data of the same sample size as the tested data are generated and plotted on the perimeter of the graph while a Q-Q plot of the actual data is depicted in the center of the graph.
ntester(actual.data)Arguments
- actual.data
is a numeric vector. Missing and infinite values are allowed, but are ignored in the calculation. The length of
actual.datamust be less than 5000 after dropping nonfinite values.
Details
Q-Q plots of randomly generated normal data of the same size as the tested data are generated and plotted on the perimeter of the graph sheet while a Q-Q plot of the actual data is depicted in the center of the graph. The p-values are calculated based on the Shapiro-Wilk W-statistic. Function will only work on numeric vectors containing less than or equal to 5000 observations. Best used for moderate sized samples (n < 50).
References
Shapiro, S.S. and Wilk, M.B. 1965. An analysis of variance test for normality (complete samples). Biometrika 52: 591-611.
Examples
ntester(actual.data = rexp(40, 1))

# Q-Q plot of random exponential data in center plot
# surrounded by 8 Q-Q plots of randomly generated
# standard normal data of size 40.
# Q-Q plot of random exponential data in center plot
# surrounded by 8 Q-Q plots of randomly generated
# standard normal data of size 40.