Random sample of wool production in thousands of kilograms on 5 different days at two different locations
WOOLFormat
A data frame with 30 observations on the following 2 variables:
production(wool production in thousands of kilograms)location(a factor with levelstextileAandtextileB.)
References
Ugarte, M. D., Militino, A. F., and Arnholt, A. T. 2015. Probability and Statistics with R, Second Edition. Chapman & Hall / CRC.
Examples
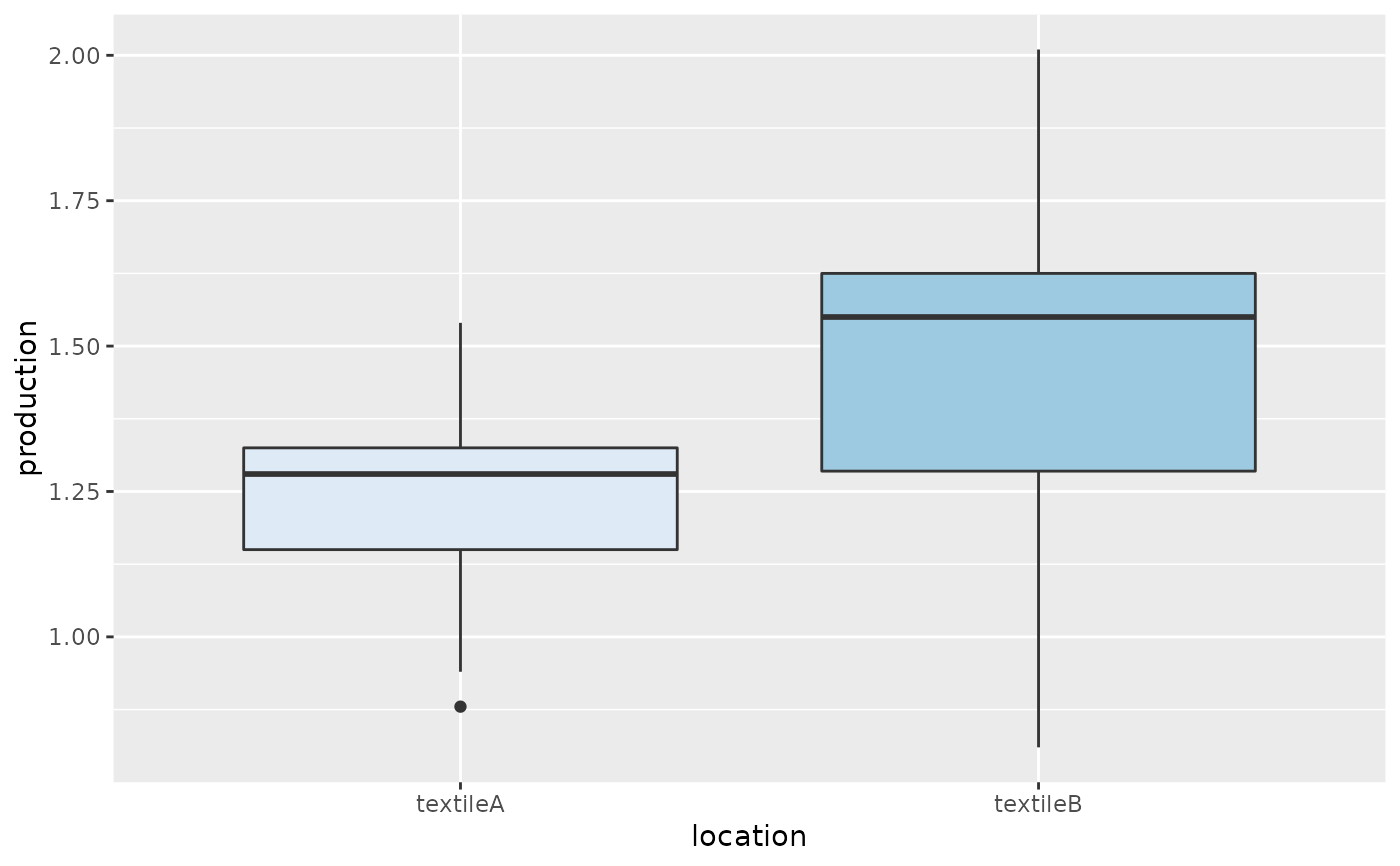
ggplot(data = WOOL, aes(location, production, fill = location)) + geom_boxplot() +
guides(fill = "none") + scale_fill_brewer()

t.test(production ~ location, data = WOOL)
#>
#> 	Welch Two Sample t-test
#>
#> data:  production by location
#> t = -2.266, df = 20.619, p-value = 0.03435
#> alternative hypothesis: true difference in means is not equal to 0
#> 95 percent confidence interval:
#>  -0.42213539 -0.01786461
#> sample estimates:
#> mean in group textileA mean in group textileB
#>                  1.226                  1.446
#>
t.test(production ~ location, data = WOOL)
#>
#> Welch Two Sample t-test
#>
#> data: production by location
#> t = -2.266, df = 20.619, p-value = 0.03435
#> alternative hypothesis: true difference in means is not equal to 0
#> 95 percent confidence interval:
#> -0.42213539 -0.01786461
#> sample estimates:
#> mean in group textileA mean in group textileB
#> 1.226 1.446
#>