The data come from an experiment to study the gain in weight of rats fed on four different diets, distinguished by amount of protein (low and high) and by source of protein (beef and cereal).
WEIGHTGAINFormat
A data frame with 40 observations on the following 3 variables:
proteinsource(a factor with levelsBeefandCereal)proteinamount(a factor with levelsHighandLow)weightgain(weight gained in grams)
Source
Hand, D. J., F. Daly, A. D. Lunn, K. J. McConway, and E. Ostrowski. 1994. A Handbook of Small Datasets. Chapman and Hall/CRC, London.
Details
The design of the experiment is a completely randomized design with ten rats in each of the four treatments.
References
Ugarte, M. D., Militino, A. F., and Arnholt, A. T. 2015. Probability and Statistics with R, Second Edition. London: Chapman & Hall.
Examples
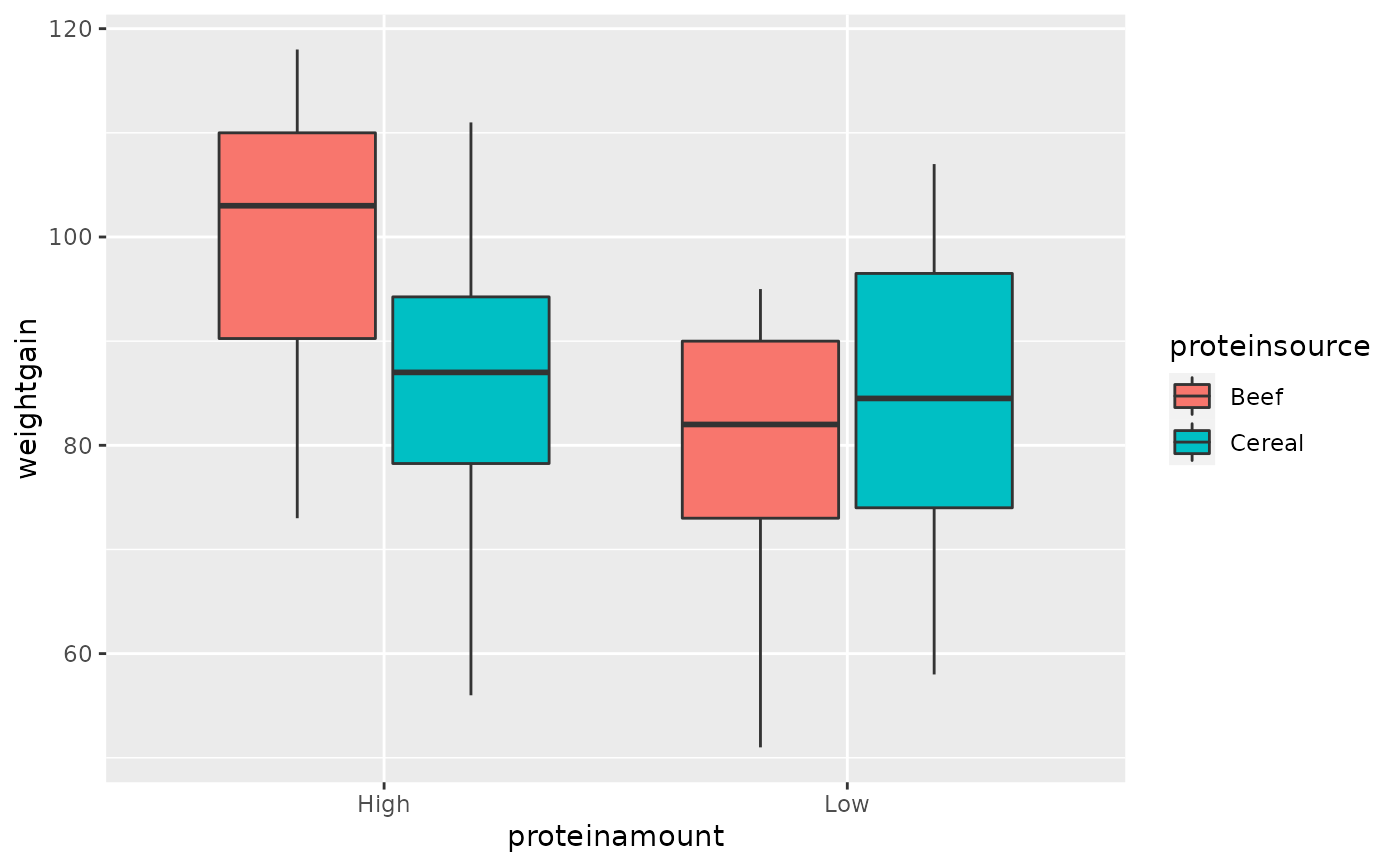
ggplot(data = WEIGHTGAIN, aes(x = proteinamount, y = weightgain,
fill = proteinsource)) + geom_boxplot()

aov(weightgain ~ proteinsource*proteinamount, data = WEIGHTGAIN)
#> Call:
#>    aov(formula = weightgain ~ proteinsource * proteinamount, data = WEIGHTGAIN)
#>
#> Terms:
#>                 proteinsource proteinamount proteinsource:proteinamount
#> Sum of Squares          220.9        1299.6                       883.6
#> Deg. of Freedom             1             1                           1
#>                 Residuals
#> Sum of Squares     8049.4
#> Deg. of Freedom        36
#>
#> Residual standard error: 14.95307
#> Estimated effects may be unbalanced
aov(weightgain ~ proteinsource*proteinamount, data = WEIGHTGAIN)
#> Call:
#> aov(formula = weightgain ~ proteinsource * proteinamount, data = WEIGHTGAIN)
#>
#> Terms:
#> proteinsource proteinamount proteinsource:proteinamount
#> Sum of Squares 220.9 1299.6 883.6
#> Deg. of Freedom 1 1 1
#> Residuals
#> Sum of Squares 8049.4
#> Deg. of Freedom 36
#>
#> Residual standard error: 14.95307
#> Estimated effects may be unbalanced