An independent agency measures the sodium content in 20 samples from source x and in 10 samples from source y and stores them in the data frame WATER.
WATERFormat
A data frame with 30 observations on the following 4 variables:
x(sodium content measured in mg/L)y(sodium content measured in mg/L)sodium(combined sodium content measured in mg/L)source(a factor with levelsxandy)
References
Ugarte, M. D., Militino, A. F., and Arnholt, A. T. 2015. Probability and Statistics with R, Second Edition. Chapman & Hall / CRC.
Examples
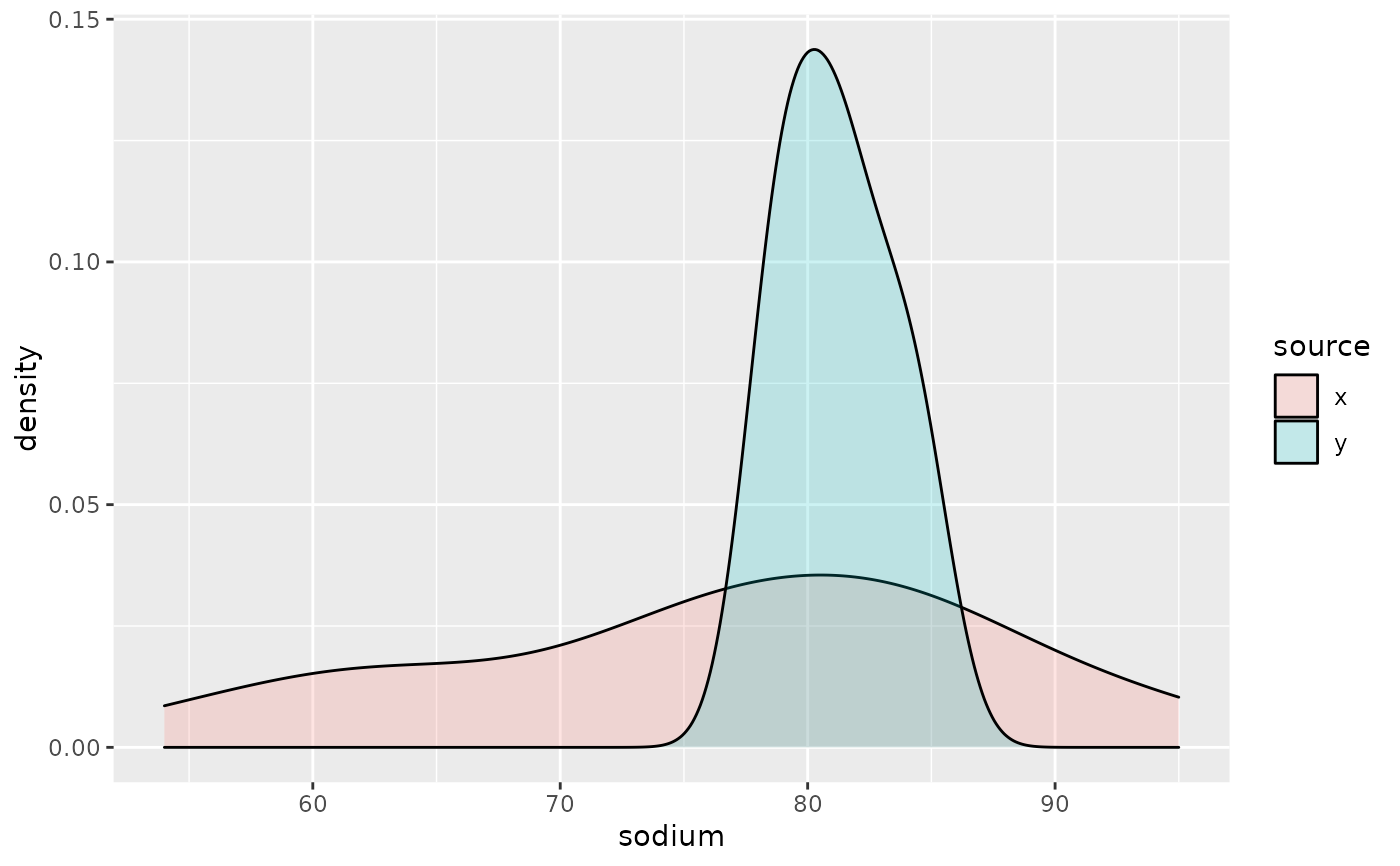
ggplot(data = WATER, aes(x = sodium, y = ..density.., fill = source)) +
geom_density(alpha = 0.2)

t.test(sodium ~ source, data = WATER, alternative = "less")
#>
#> 	Welch Two Sample t-test
#>
#> data:  sodium by source
#> t = -1.8589, df = 22.069, p-value = 0.03822
#> alternative hypothesis: true difference in means is less than 0
#> 95 percent confidence interval:
#>        -Inf -0.3665724
#> sample estimates:
#> mean in group x mean in group y
#>            76.4            81.2
#>
t.test(sodium ~ source, data = WATER, alternative = "less")
#>
#> Welch Two Sample t-test
#>
#> data: sodium by source
#> t = -1.8589, df = 22.069, p-value = 0.03822
#> alternative hypothesis: true difference in means is less than 0
#> 95 percent confidence interval:
#> -Inf -0.3665724
#> sample estimates:
#> mean in group x mean in group y
#> 76.4 81.2
#>