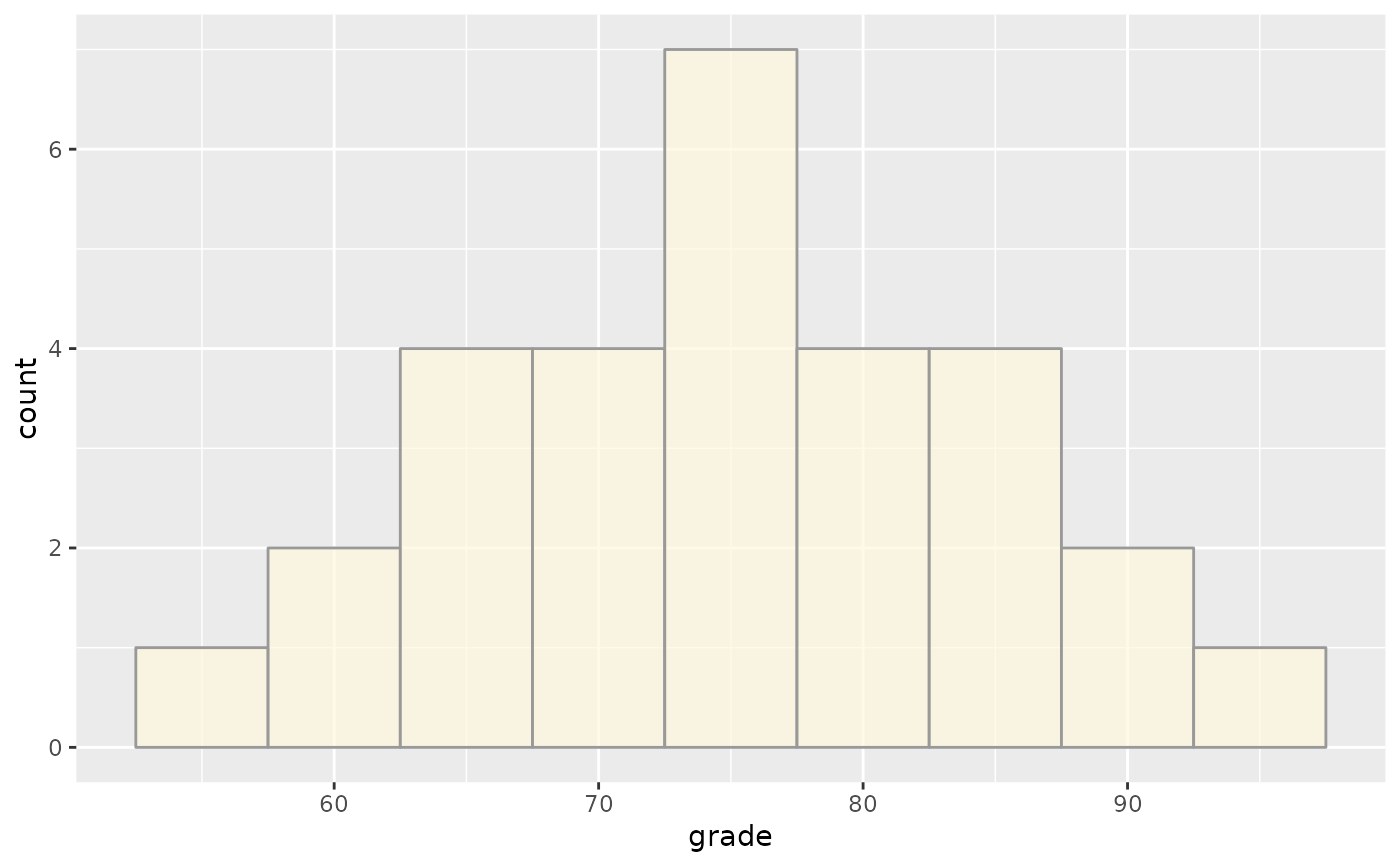
Test grades of 29 students taking a basic statistics course
TESTSCORESFormat
A data frame with 29 observations on the following variable:
grade(test score)
References
Ugarte, M. D., Militino, A. F., and Arnholt, A. T. 2015. Probability and Statistics with R, Second Edition. Chapman & Hall / CRC.
Examples
ggplot(data = TESTSCORES, aes(x = grade)) + geom_histogram(binwidth = 5,
fill = "cornsilk", color = "gray60", alpha = 0.7)