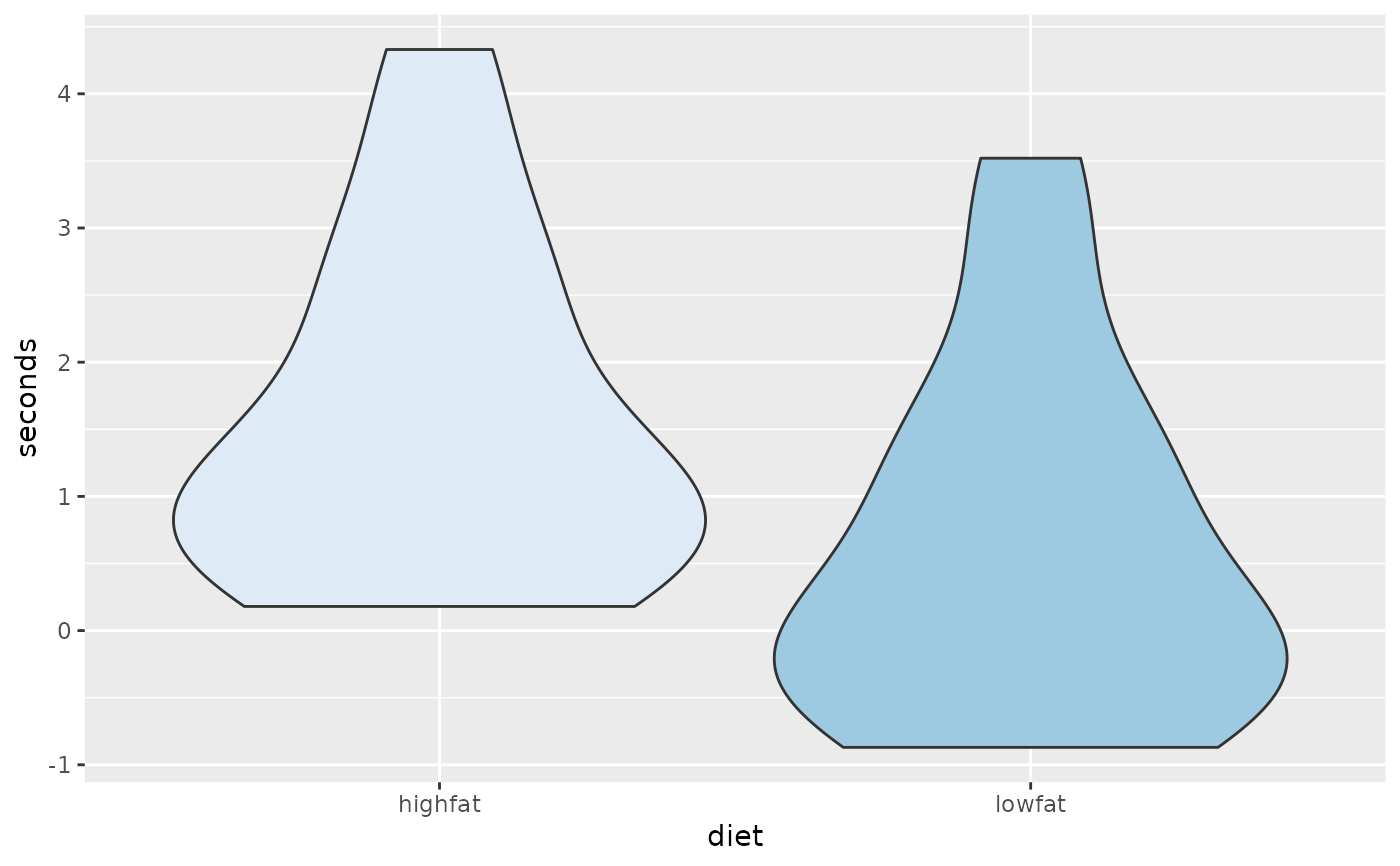
Swimmers' improvements in seconds for two diets are stored in the data frame SWIMTIMES. The values in seconds represent the time improvement in seconds for swimmers.
SWIMTIMESFormat
A data frame with 28 observations on the following 2 variables:
seconds(time improvement in seconds)diet(a factor with levelslowfatandhighfat)
Details
Times for the thirty-two swimmers for the 200 yard individual medley were taken right after the swimmers' conference meet. The swimmers were randomly assigned to follow one of the diets. One group followed a low fat diet the entire year but lost two swimmers along the way. The other group followed a high fat diet the entire year and also lost two swimmers.
References
Ugarte, M. D., Militino, A. F., and Arnholt, A. T. 2015. Probability and Statistics with R, Second Edition. Chapman & Hall / CRC.
Examples
wilcox.test(seconds ~ diet, data = SWIMTIMES)
#> Warning: cannot compute exact p-value with ties
#>
#> 	Wilcoxon rank sum test with continuity correction
#>
#> data:  seconds by diet
#> W = 143, p-value = 0.04072
#> alternative hypothesis: true location shift is not equal to 0
#>
ggplot(data = SWIMTIMES, aes(x = diet, y = seconds, fill = diet)) + geom_violin() +
guides(fill = "none") + scale_fill_brewer()