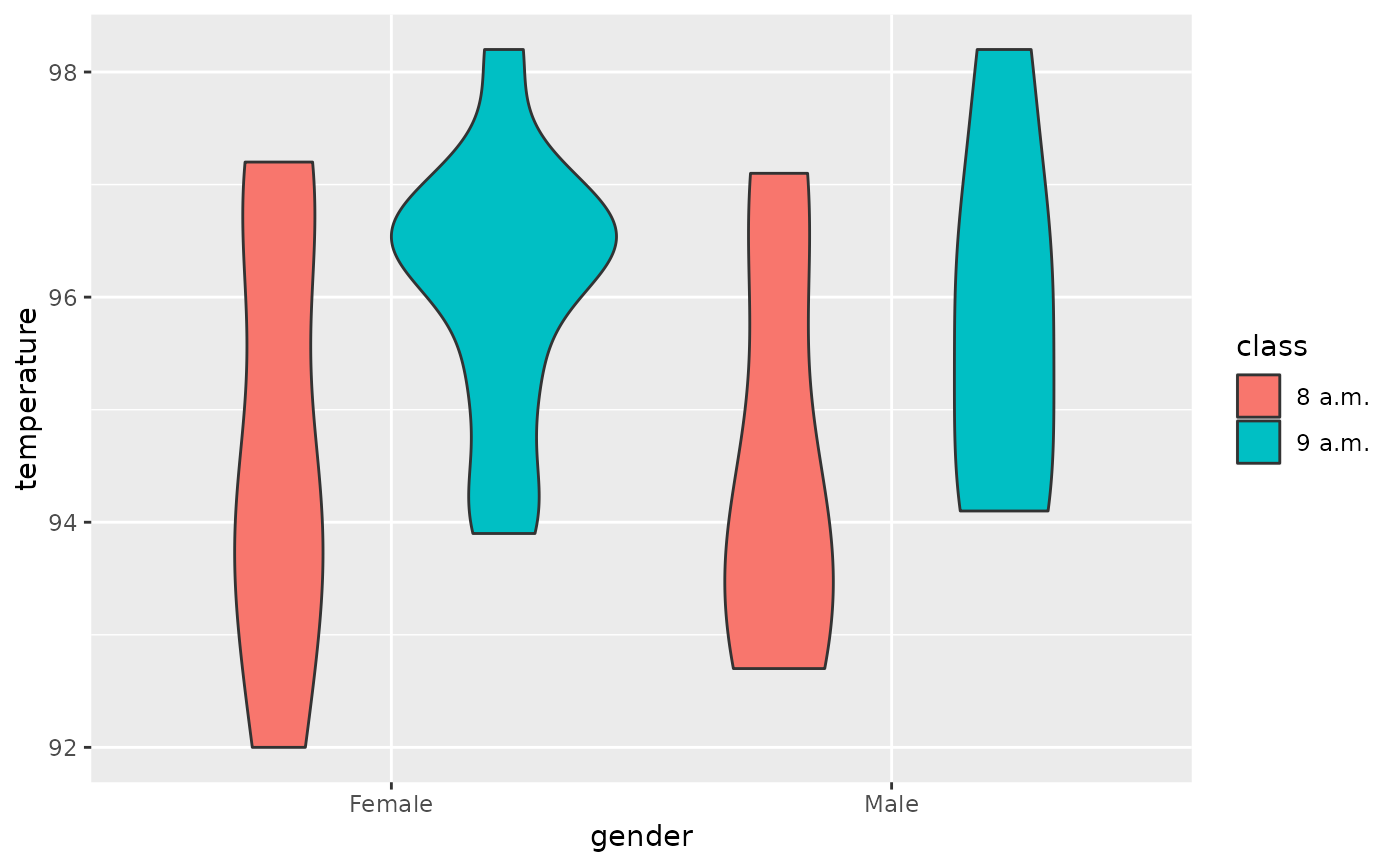
In a study conducted at Appalachian State University, students used digital oral thermometers to record their temperatures each day they came to class. A randomly selected day of student temperatures is provided in STATTEMPS. Information is also provided with regard to subject gender and the hour of the day when the students' temperatures were measured.
STATTEMPSFormat
A data frame with 34 observations on the following 3 variables:
temperature(temperature in Fahrenheit)gender(a factor with levelsFemaleandMale)class(a factor with levels8 a.m.and9 a.m.)
References
Ugarte, M. D., Militino, A. F., and Arnholt, A. T. 2015. Probability and Statistics with R, Second Edition. Chapman & Hall / CRC.
Examples
p <- ggplot(data = STATTEMPS, aes(x = gender, y =temperature, fill = class))
p + geom_violin()
