Sixty 18 cubic feet refrigerators were randomly selected from a company's warehouse. The first thirty had their motors modified while the last thirty were left intact. The energy consumption (kilowatts) for a 24 hour period for each refrigerator was recorded and stored in the variable kilowatts.
REFRIGERATORFormat
A data frame with 60 observations on the following 2 variables:
kilowatts(energy consumption in kilowatts for a 24 hour period)group(factor with levelsoriginalandmodified)
References
Ugarte, M. D., Militino, A. F., and Arnholt, A. T. 2015. Probability and Statistics with R, Second Edition. Chapman & Hall / CRC.
Examples
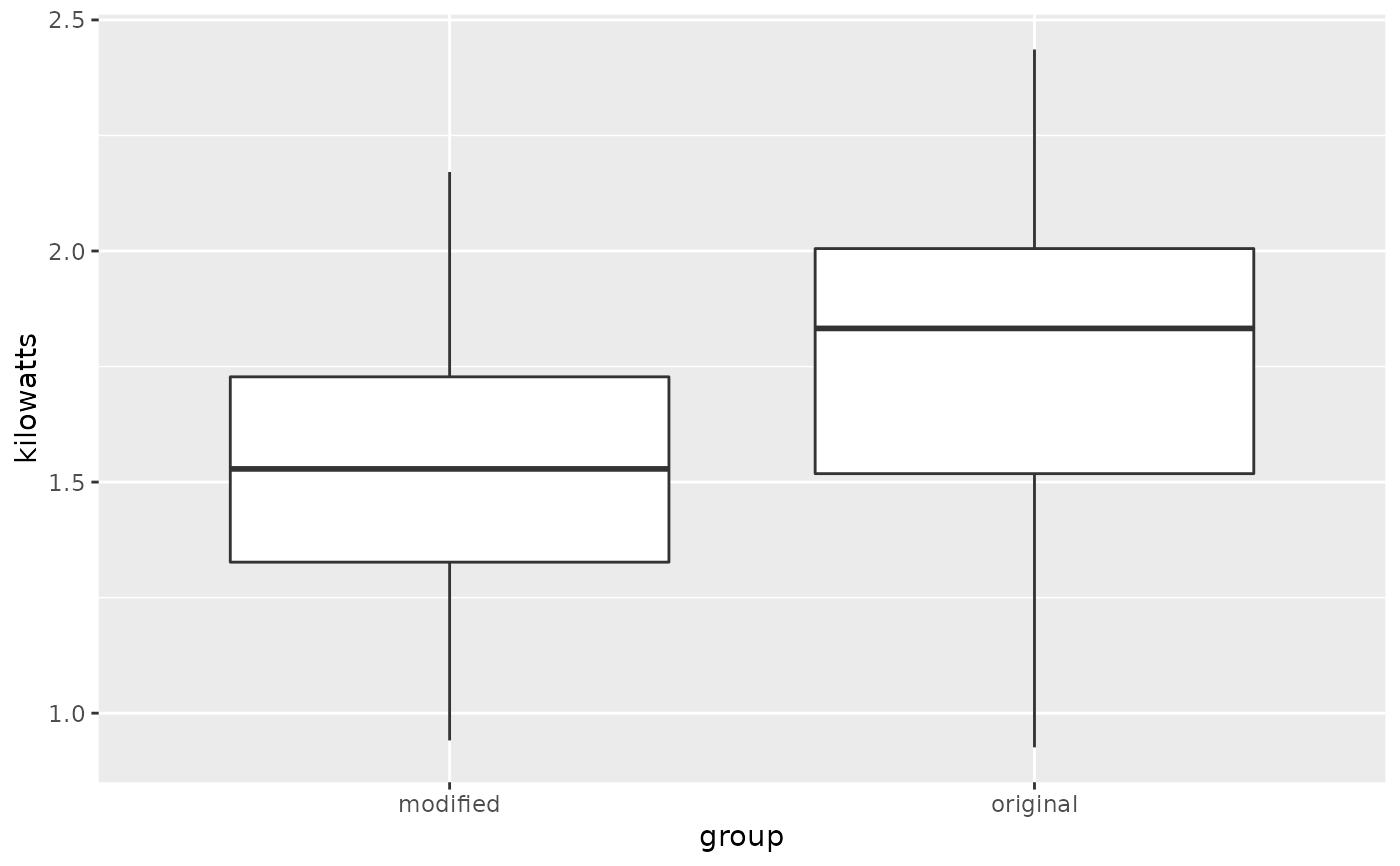
# Boxplot
ggplot(data = REFRIGERATOR, aes(x = group, y = kilowatts)) + geom_boxplot()
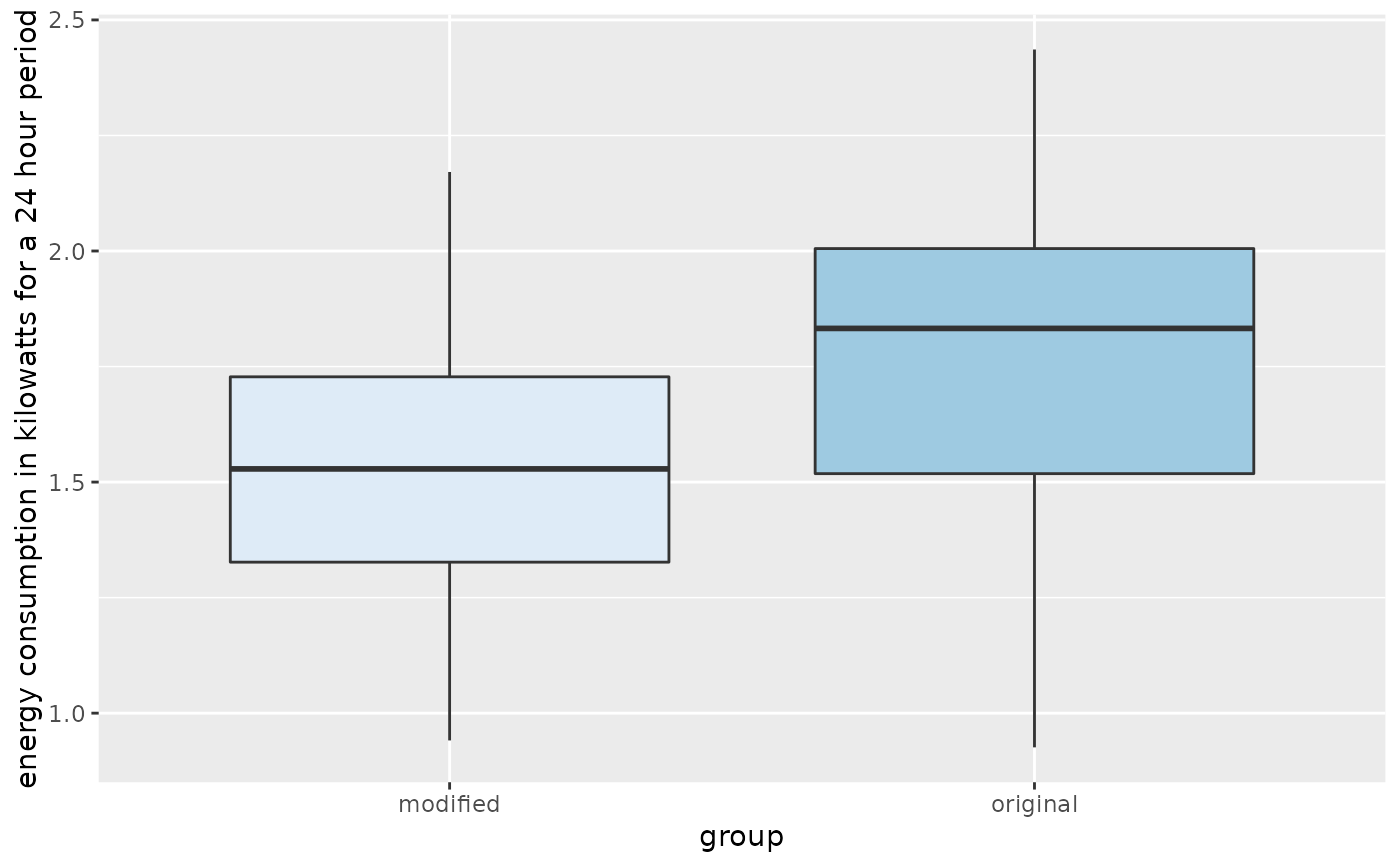
 ggplot(data = REFRIGERATOR, aes(x = group, y = kilowatts, fill = group)) +
geom_boxplot() + labs(y = "energy consumption in kilowatts for a 24 hour period") +
guides(fill = "none") + scale_fill_brewer()
ggplot(data = REFRIGERATOR, aes(x = group, y = kilowatts, fill = group)) +
geom_boxplot() + labs(y = "energy consumption in kilowatts for a 24 hour period") +
guides(fill = "none") + scale_fill_brewer()