Twelve rats were chosen, and a drug was administered to six rats, the treatment group, chosen at random. The other six rats, the control group, received a placebo. The drops in blood pressure (mmHg) for the treatment group (with probability distribution F) and the control group (with probability distribution G), respectively, were recorded.
RATBPFormat
A data frame with 12 observations on the following 2 variables:
mmHg(drops in blood pressure in mm of Hg where positive values are decreases, negative values are increases)group(factor with levelscontrolandtreatment)
Source
The data is originally from Ott and Mendenhall (Understanding Statistics, 1985, problem 8.17).
References
Ugarte, M. D., Militino, A. F., and Arnholt, A. T. 2015. Probability and Statistics with R, Second Edition. Chapman & Hall / CRC.
Examples
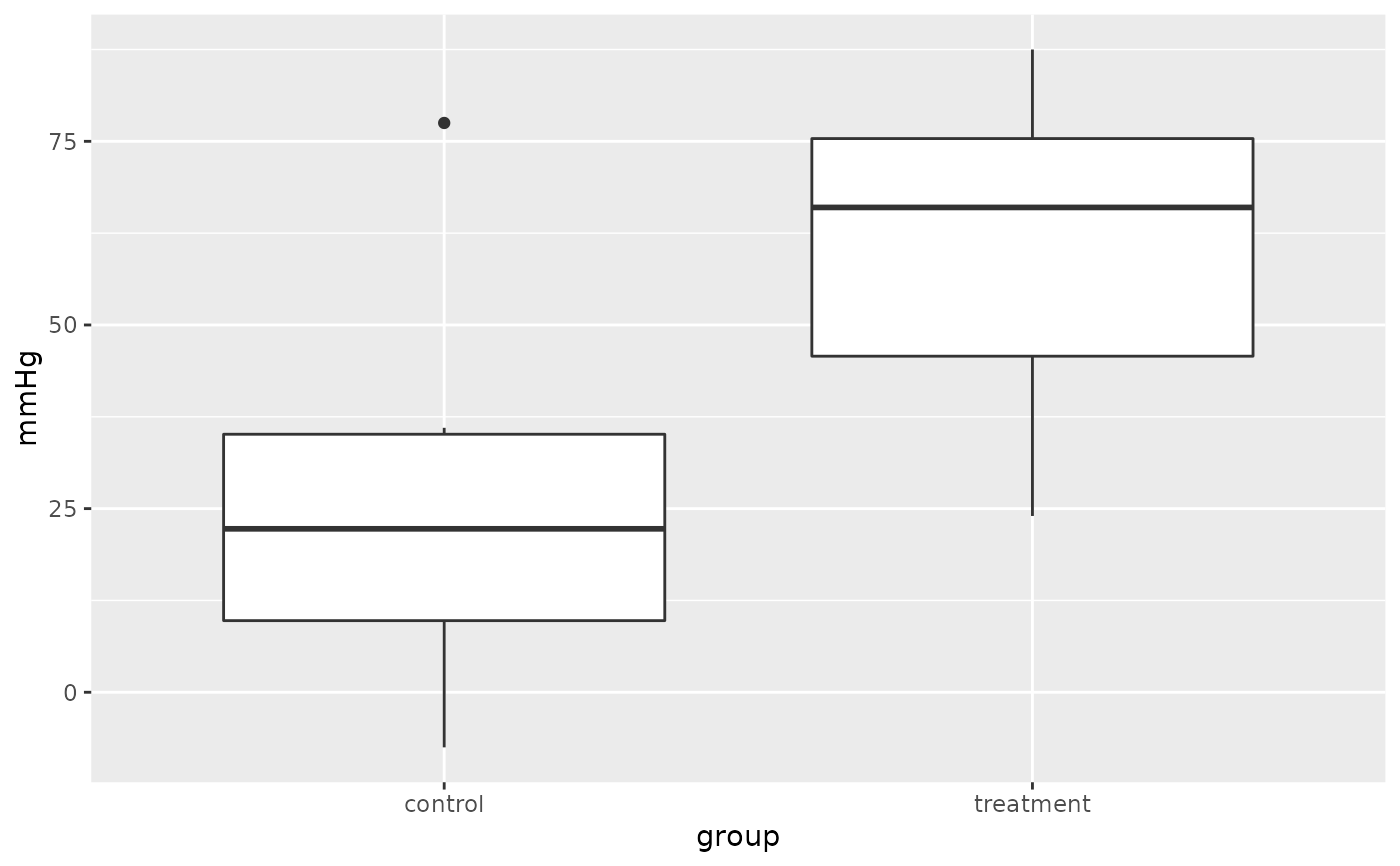
# Boxplot
ggplot(data = RATBP, aes(x = group, y = mmHg)) + geom_boxplot()
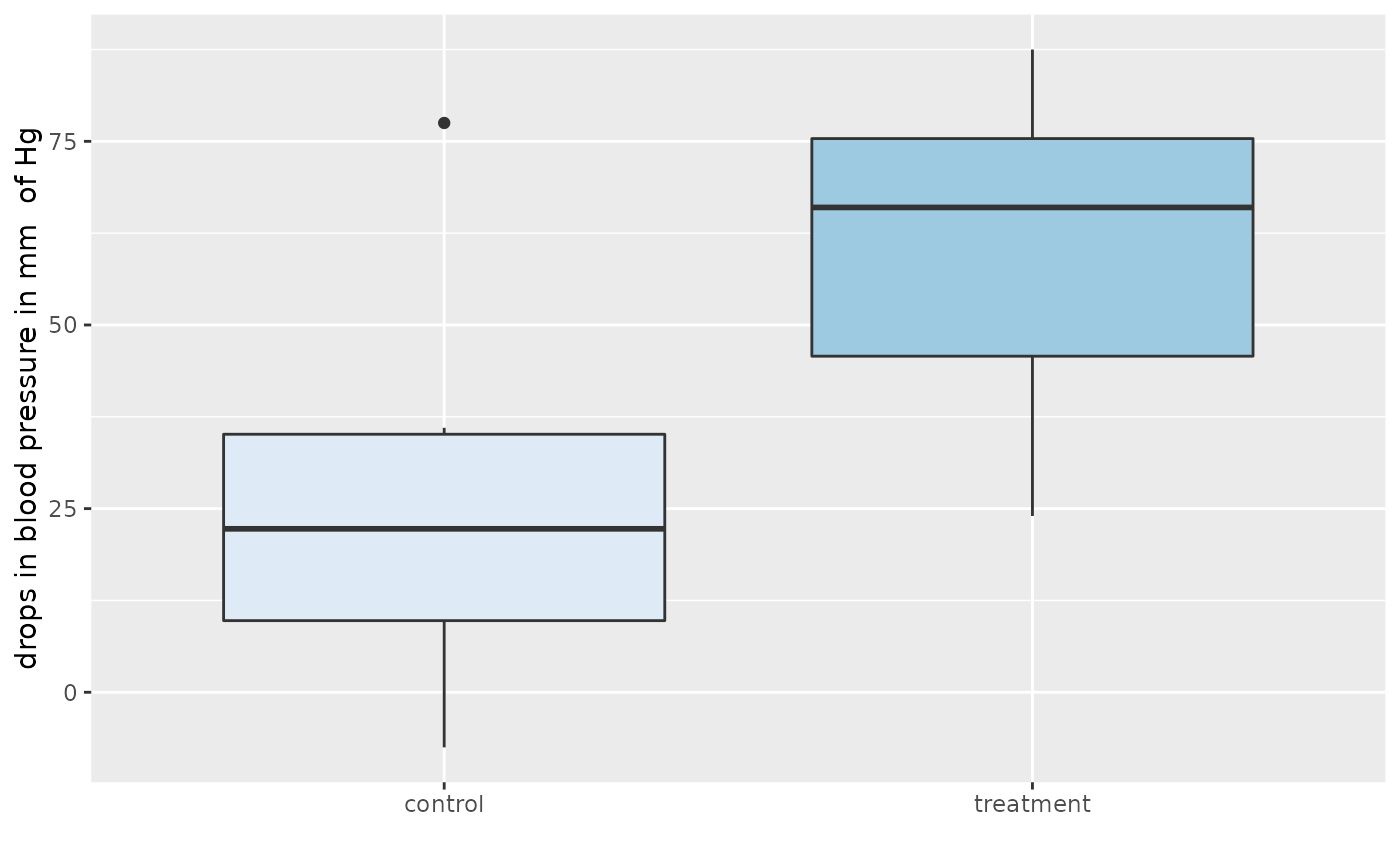
 ggplot(data = RATBP, aes(x = group, y = mmHg, fill = group)) + geom_boxplot() +
guides(fill = "none") + labs(x = "", y = "drops in blood pressure in mm of Hg") +
scale_fill_brewer()
ggplot(data = RATBP, aes(x = group, y = mmHg, fill = group)) + geom_boxplot() +
guides(fill = "none") + labs(x = "", y = "drops in blood pressure in mm of Hg") +
scale_fill_brewer()