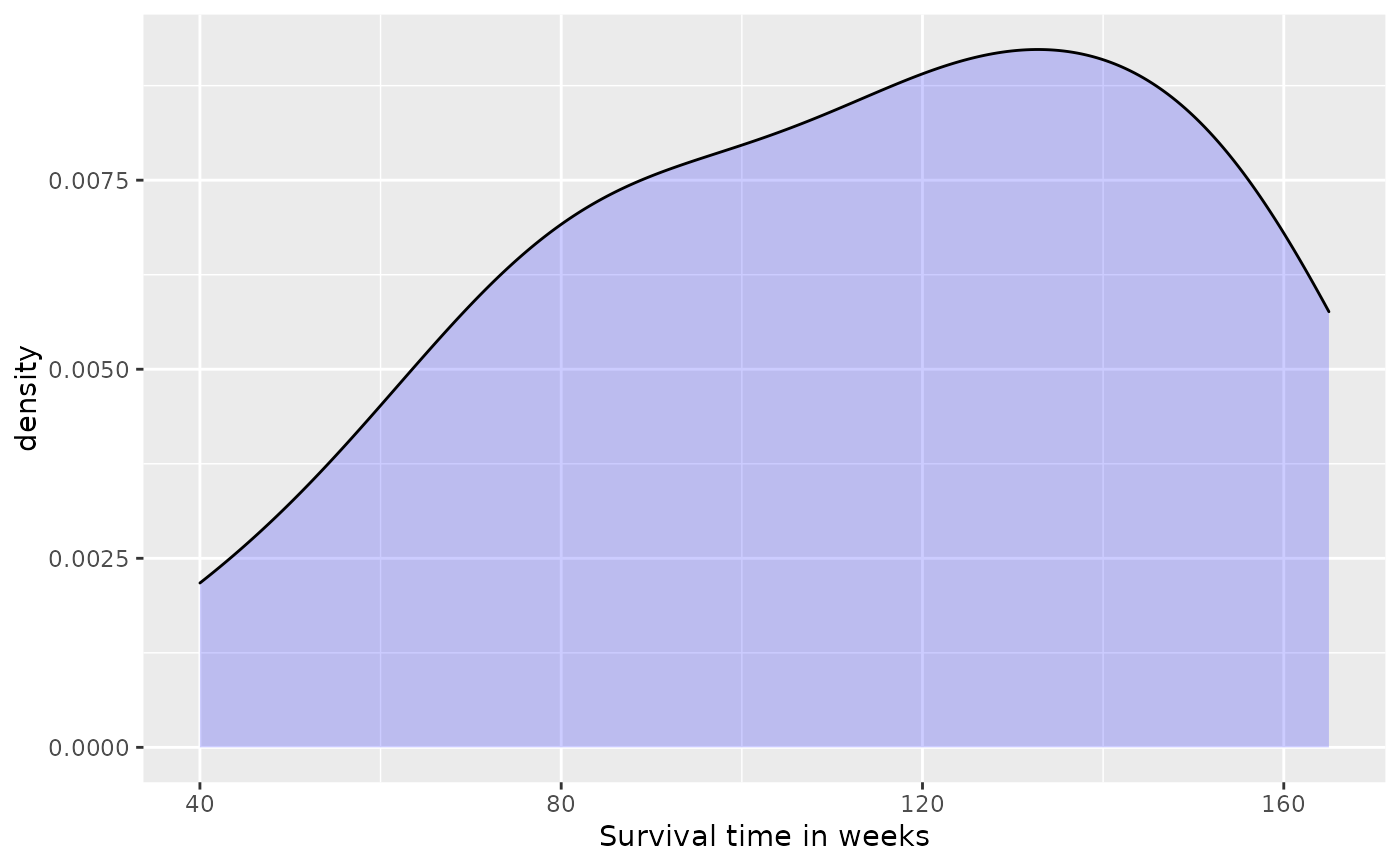
The survival time in weeks of 20 male rats exposed to high levels of radiation
RATFormat
A data frame with 20 observations on the following variable:
survival.time(number of weeks survived)
Source
Lawless, J. 1982. Statistical Models and Methods for Lifetime Data. John Wiley, New York.
References
Ugarte, M. D., Militino, A. F., and Arnholt, A. T. 2015. Probability and Statistics with R, Second Edition. Chapman & Hall / CRC.
Examples
ggplot(data = RAT, aes(sample = survival.time)) + stat_qq()

ggplot(data = RAT, aes(x = survival.time)) + geom_density(alpha = 0.2, fill = "blue") +
labs(x = "Survival time in weeks")
