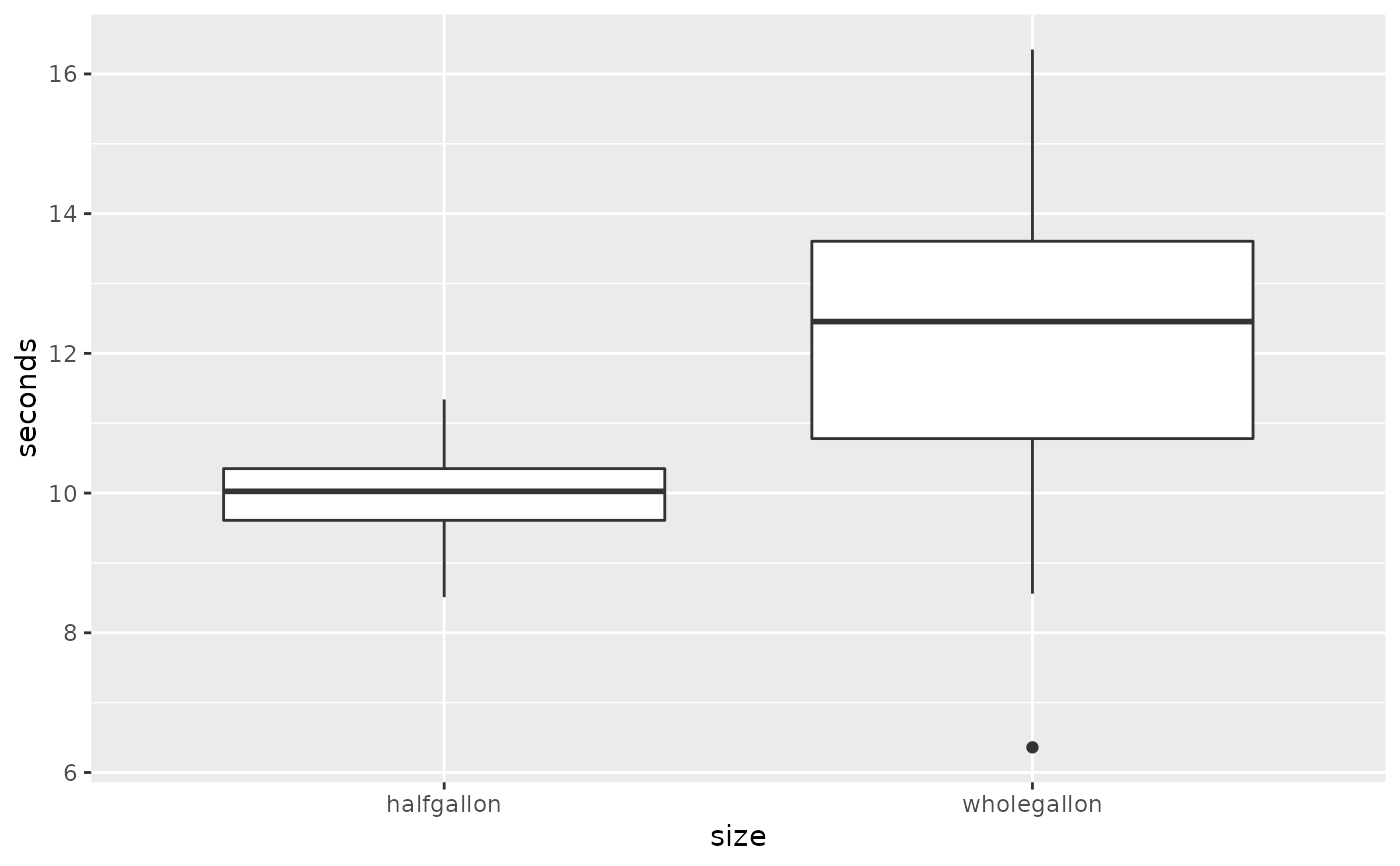
A plastics manufacturer makes two sizes of milk containers: half gallon and gallon sizes. The time required for each size to dry is recorded in seconds in the data frame MILKCARTON.
MILKCARTONFormat
A data frame with 80 observations on the following 2 variables:
seconds(drying time in seconds)size(factor with levelshalfgallonandwholegallon)
References
Ugarte, M. D., Militino, A. F., and Arnholt, A. T. 2015. Probability and Statistics with R, Second Edition. Chapman & Hall / CRC.
Examples
ggplot(data = MILKCARTON, aes(x = size, y = seconds)) + geom_boxplot()

ggplot(data = MILKCARTON, aes(x = size, y = seconds, fill = size)) + geom_boxplot() +
guides(fill = "none") + scale_fill_brewer() +
labs(x = "size of container", y = "drying time in seconds")
ggplot(data = MILKCARTON, aes(x = size, y = seconds, fill = size)) + geom_boxplot() +
guides(fill = "none") + scale_fill_brewer() +
labs(x = "size of container", y = "drying time in seconds")
