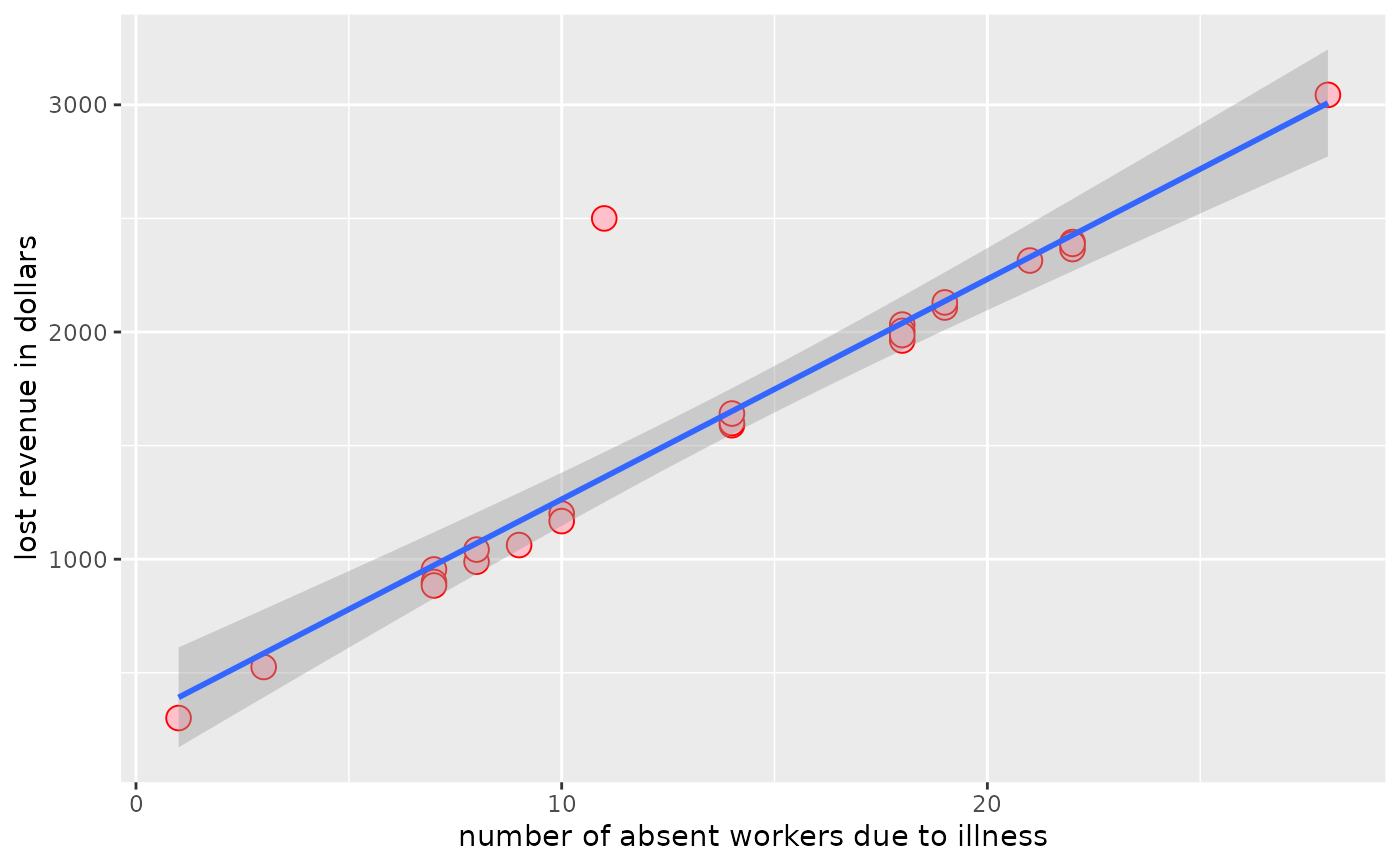
Data set containing the lost revenue in dollars/day and number of workers absent due to illness for a metallurgic company
LOSTRFormat
A data frame with 25 observations on the following 2 variables:
numbersick(number of absent workers due to illness)lostrevenue(lost revenue in dollars)
References
Ugarte, M. D., Militino, A. F., and Arnholt, A. T. 2015. Probability and Statistics with R, Second Edition. Chapman & Hall / CRC.
Examples
ggplot(data = LOSTR, aes(x = numbersick, y = lostrevenue)) + geom_point(color = "red",
pch = 21, fill = "pink", size = 4) + geom_smooth(method = "lm") +
labs(x = "number of absent workers due to illness", y = "lost revenue in dollars")
#> `geom_smooth()` using formula 'y ~ x'
