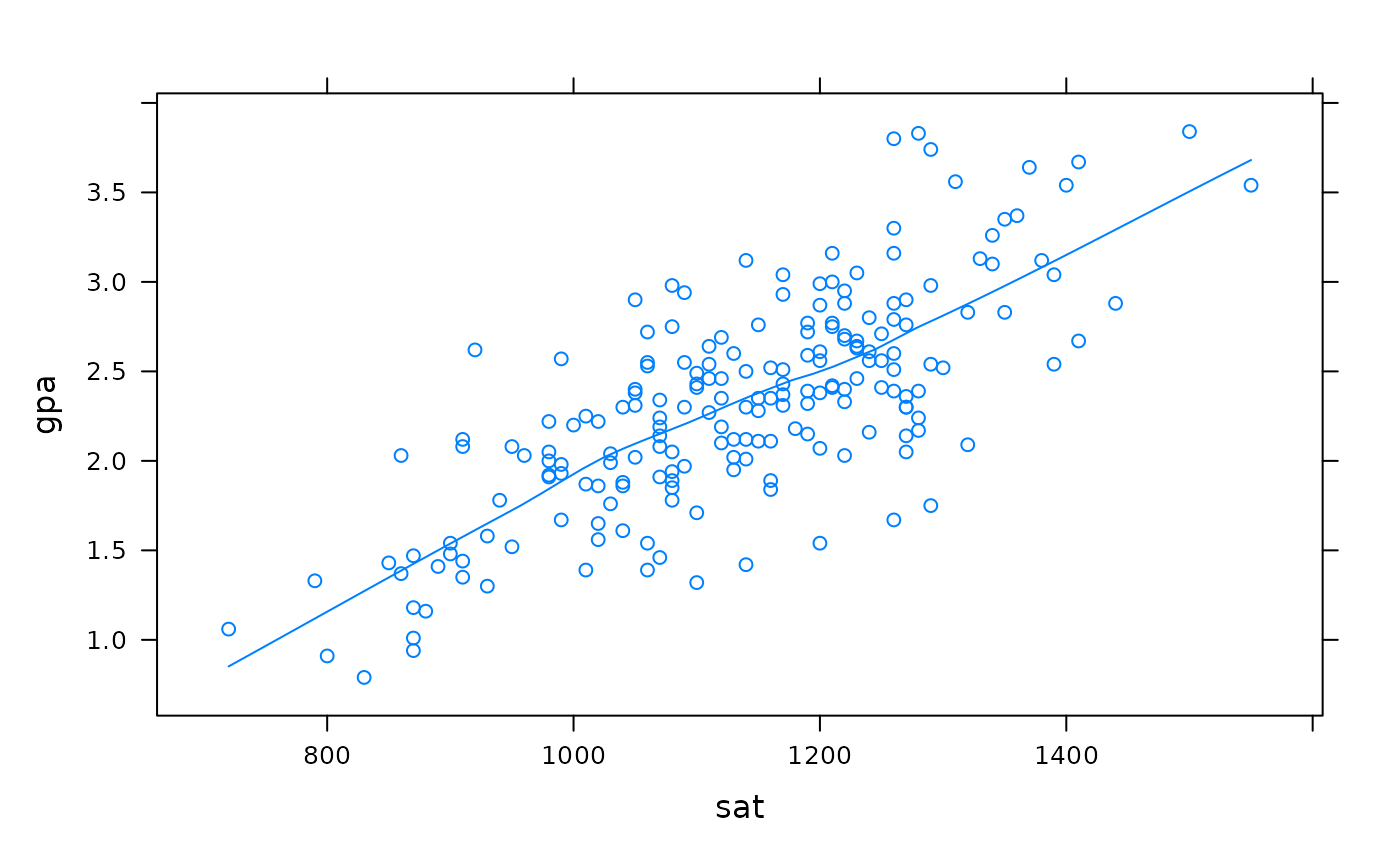
The admissions committee of a comprehensive state university selected, at random, the records of 200 second semester freshmen. The results, first semester college GPA and high school SAT scores, are stored in the data frame GRADES.
GRADESFormat
A data frame with 200 observations on the following 2 variables:
sat(SAT score)gpa(grade point average)
References
Ugarte, M. D., Militino, A. F., and Arnholt, A. T. 2015. Probability and Statistics with R, Second Edition. Chapman & Hall / CRC.