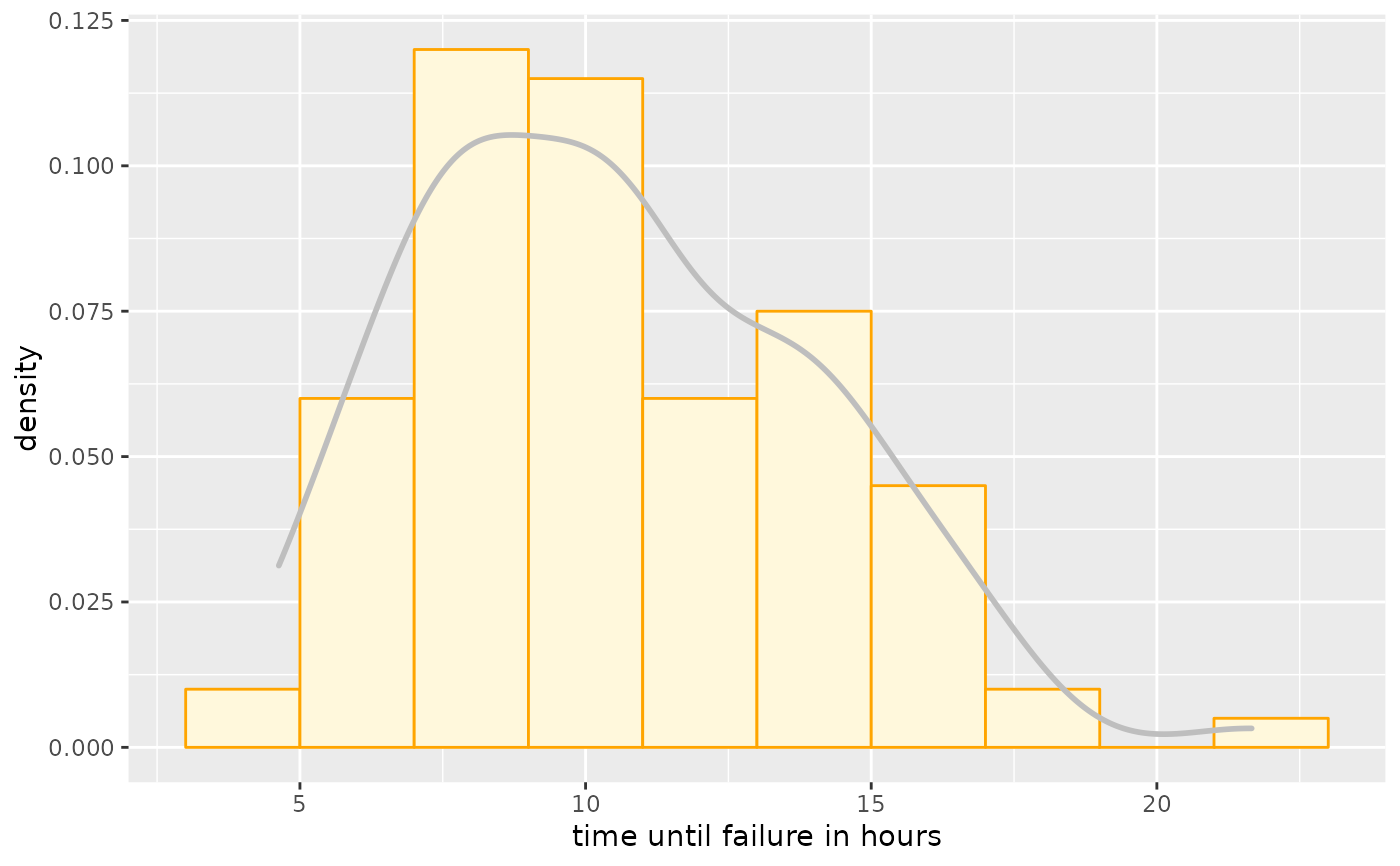
Contains time until failure in hours for a particular electronic component subjected to an accelerated stress test
GDFormat
A data frame with 100 observations on the following variable:
attf(times until failure in hours)
References
Ugarte, M. D., Militino, A. F., and Arnholt, A. T. 2015. Probability and Statistics with R, Second Edition. Chapman & Hall / CRC.
Examples
ggplot(data = GD, aes(x = attf, y = ..density..)) +
geom_histogram(binwidth = 2, fill = "cornsilk", color = "orange") +
geom_density(color = "gray", size = 1) + labs( x = "time until failure in hours")
