Pit stop times for two teams at 10 randomly selected Formula 1 races
FORMULA1Format
A data frame with 10 observations on the following 3 variables:
race(number corresponding to a race site)team1(pit stop times for team one)team2(pit stop times for team two)
References
Ugarte, M. D., Militino, A. F., and Arnholt, A. T. 2015. Probability and Statistics with R, Second Edition. Chapman & Hall / CRC.
Examples
# Change data format from wide to long
# library(reshape2)
# F1L <- melt(data = FORMULA1, id.vars = "race", variable.name = "team",
# value.name = "time")
# ggplot(data = F1L, aes(x = team, y = time)) + geom_boxplot()
# Using reshape()
F1L <- reshape(FORMULA1, varying = c("team1", "team2"), v.names = "time",
timevar = "team", idvar = "race", direction = "long")
ggplot(data = F1L, aes(x = factor(team), y = time, fill = factor(team))) +
geom_boxplot() + guides(fill = "none") + scale_x_discrete(breaks = 1:2,
labels = c("Team 1", "Team 2")) + labs(x = "", y = "Pit stop times in seconds")
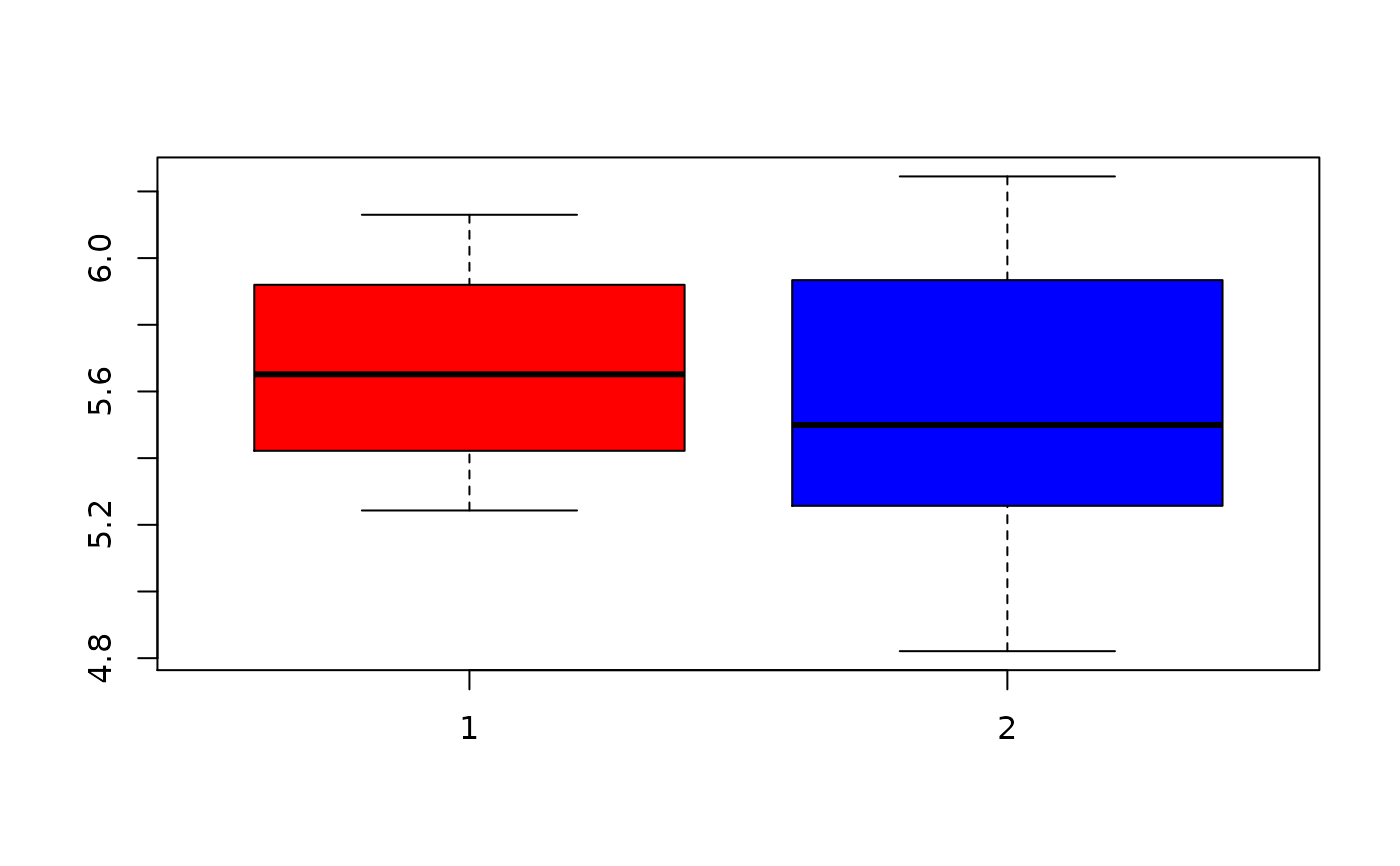
 with(data = FORMULA1,
boxplot(team1, team2, col = c("red", "blue")))
with(data = FORMULA1,
boxplot(team1, team2, col = c("red", "blue")))