Plants' heights in inches obtained from two seeds, one obtained by cross fertilization and the other by auto fertilization, in two opposite but separate locations of a pot are recorded.
FERTILIZEFormat
A data frame with 30 observations on the following 3 variables:
height(height of plant in inches)fertilization(a factor with levelscrossandself)pot(a factor with fifteen levels)
Source
Darwin, C. 1876. The Effect of Cross and Self-Fertilization in the Vegetable Kingdom. D. Appleton and Company.
References
Ugarte, M. D., Militino, A. F., and Arnholt, A. T. 2015. Probability and Statistics with R, Second Edition. Chapman & Hall / CRC.
Examples
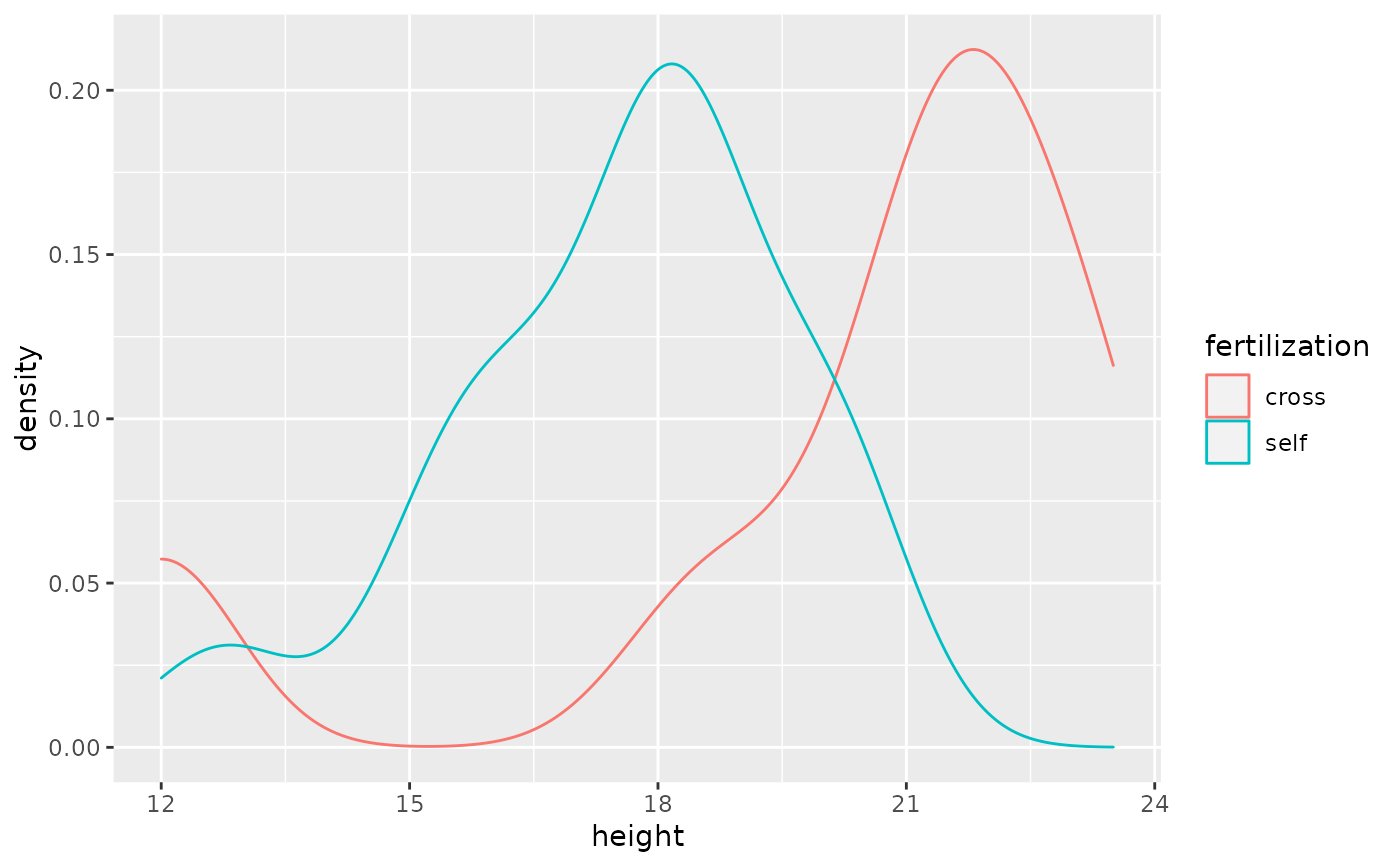
p <- ggplot(data = FERTILIZE, aes(x = height, color = fertilization))
p + geom_density()

t.test(height ~ fertilization, data = FERTILIZE)
#>
#> 	Welch Two Sample t-test
#>
#> data:  height by fertilization
#> t = 2.4371, df = 22.164, p-value = 0.02328
#> alternative hypothesis: true difference in means is not equal to 0
#> 95 percent confidence interval:
#>  0.3909566 4.8423767
#> sample estimates:
#> mean in group cross  mean in group self
#>            20.19167            17.57500
#>
t.test(height ~ fertilization, data = FERTILIZE)
#>
#> Welch Two Sample t-test
#>
#> data: height by fertilization
#> t = 2.4371, df = 22.164, p-value = 0.02328
#> alternative hypothesis: true difference in means is not equal to 0
#> 95 percent confidence interval:
#> 0.3909566 4.8423767
#> sample estimates:
#> mean in group cross mean in group self
#> 20.19167 17.57500
#>