A random sample of 15 countries' research and development investments for the years 2002 and 2003 was taken, and the results in millions of Euros are stored in EURD.
EURDFormat
A data frame with 15 observations on the following 3 variables:
country(a character vector with valuesBulgaria,Croatia,Cyprus,Czech Republic,Estonia,France,Hungary,Latvia,Lithuania,Malta,Portugal,Romania,Slovakia, andSlovenia)rd2002(research and development investments in millions of Euros for 2002)rd2003(research and development investments in millions of Euros for 2003)
References
Ugarte, M. D., Militino, A. F., and Arnholt, A. T. 2015. Probability and Statistics with R, Second Edition. Chapman & Hall / CRC.
Examples
ggplot(data = EURD, aes(x = rd2002, y = rd2003)) + geom_point() +
geom_smooth(method = "lm")
#> `geom_smooth()` using formula 'y ~ x'
 ggplot(data = EURD, aes(sample = rd2003 - rd2002)) + stat_qq()
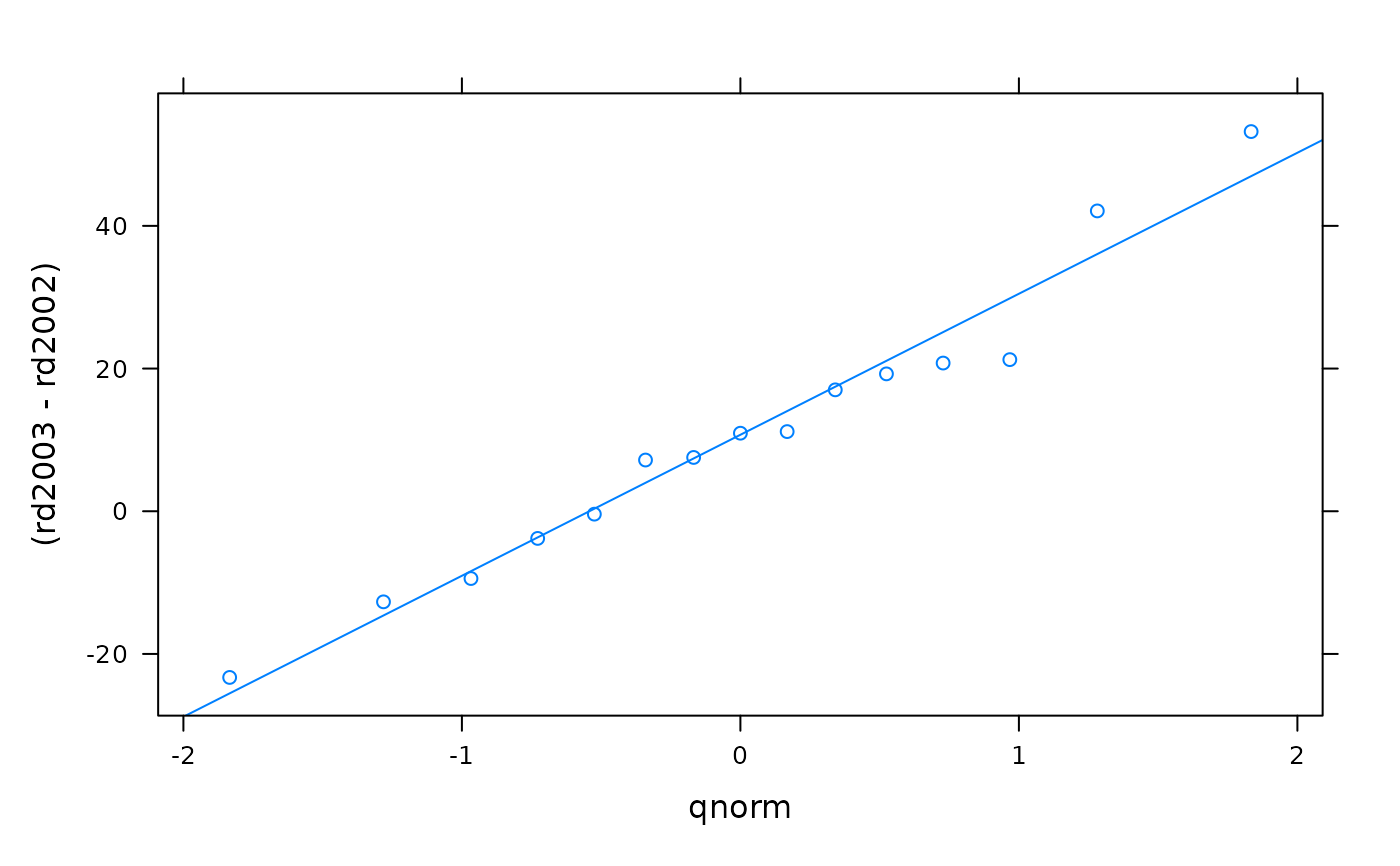
 # lattice approach
qqmath(~ (rd2003 - rd2002), data = EURD, type =c("p", "r"))
# lattice approach
qqmath(~ (rd2003 - rd2002), data = EURD, type =c("p", "r"))