Salaries for engineering graduates 10 years after graduation
ENGINEERFormat
A data frame with 51 observations on the following 2 variables:
salary(salary 10 years after graduation in thousands of dollars)university(one of three different engineering universities)
References
Ugarte, M. D., Militino, A. F., and Arnholt, A. T. 2015. Probability and Statistics with R, Second Edition. Chapman & Hall / CRC.
Examples
ggplot(data = ENGINEER, aes(x = university, y = salary, fill = university)) +
geom_boxplot() + guides(fill = "none") + scale_fill_brewer() +
labs(y = "salary 10 years after graduation \n in thousands of dollars")
#> Warning: Continuous x aesthetic -- did you forget aes(group=...)?
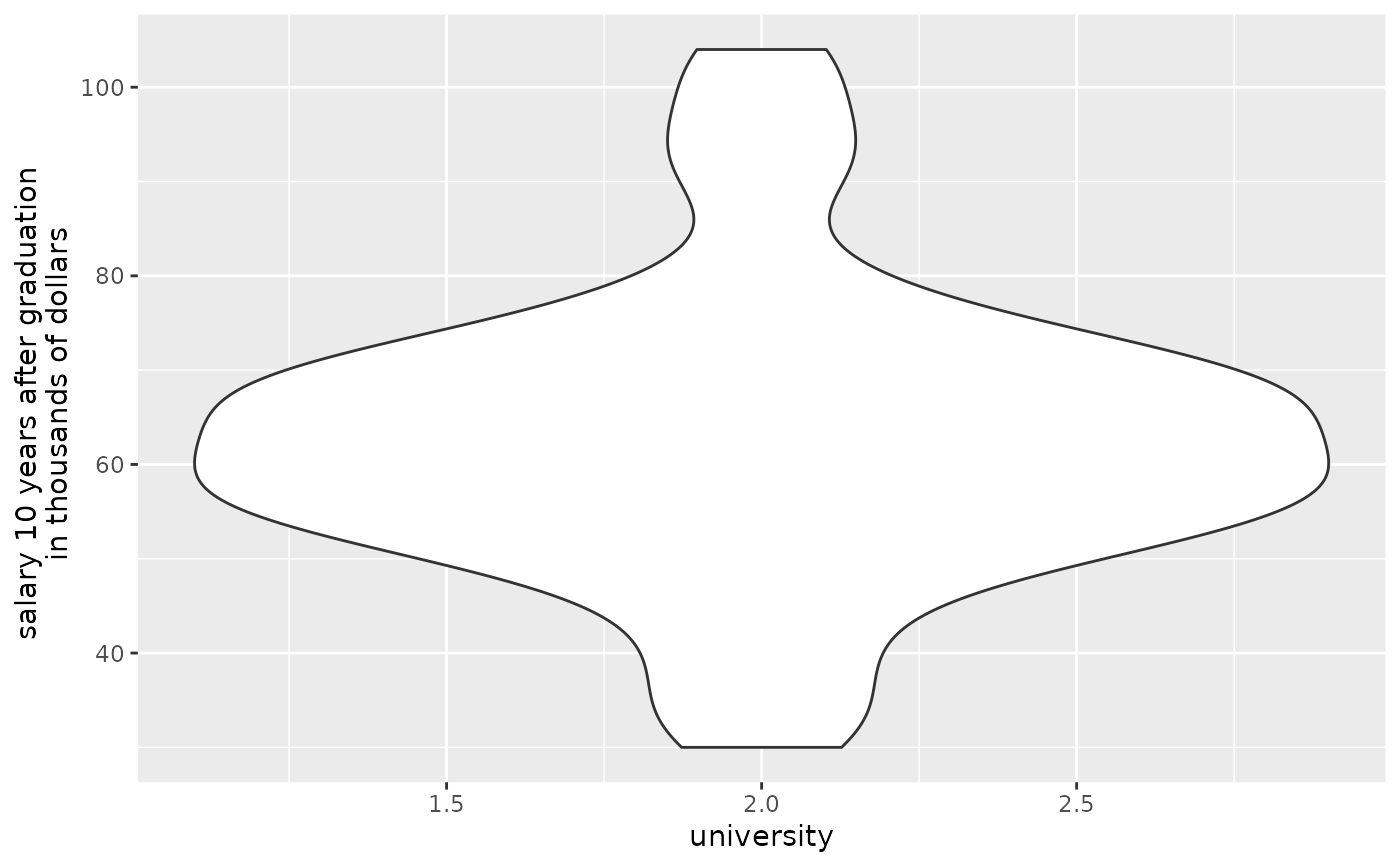
 # Violin Plots
ggplot(data = ENGINEER, aes(x = university, y = salary, fill = university)) +
geom_violin() + guides(fill = "none") + scale_fill_brewer() +
labs(y = "salary 10 years after graduation \n in thousands of dollars")
# Violin Plots
ggplot(data = ENGINEER, aes(x = university, y = salary, fill = university)) +
geom_violin() + guides(fill = "none") + scale_fill_brewer() +
labs(y = "salary 10 years after graduation \n in thousands of dollars")