The Cosmed is a portable metabolic system. A study at Appalachian State University compared the metabolic values obtained from the Cosmed to those of a reference unit (Amatek) over a range of workloads from easy to maximal to test the validity and reliability of the Cosmed. A small portion of the results for maximal oxygen consumption (VO2 in ml/kg/min) measurements taken at a 150 watt workload are stored in COSAMA.
COSAMAFormat
A data frame with 14 observations on the following 3 variables:
cosmed(measured VO2 with Cosmed)amatek(measured VO2 with Amatek)
References
Ugarte, M. D., Militino, A. F., and Arnholt, A. T. 2015. Probability and Statistics with R, Second Edition. Chapman & Hall / CRC.
Examples
# ggplot2 approach
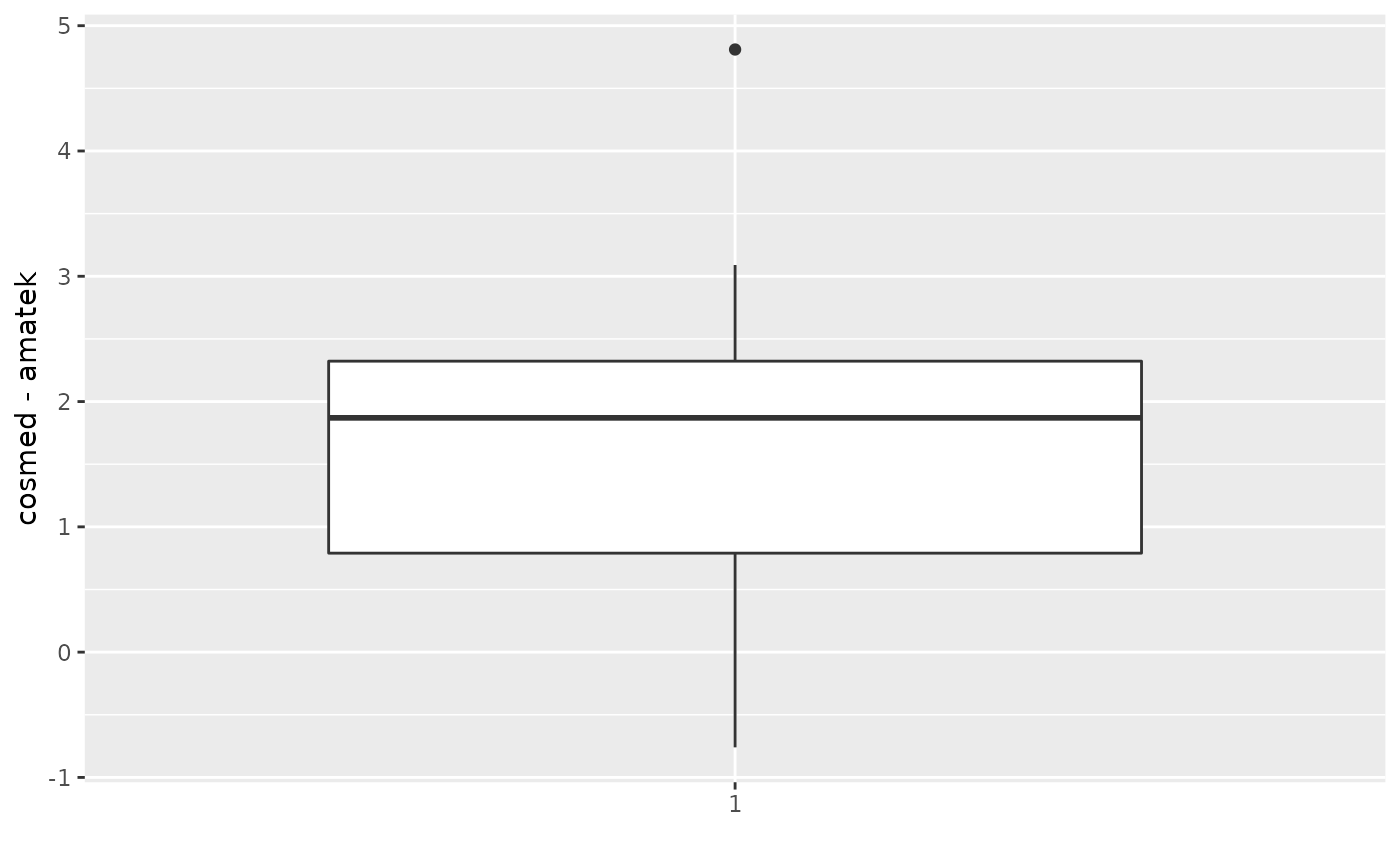
ggplot(data = COSAMA, aes(factor(1), y = cosmed - amatek)) + geom_boxplot() +
labs(x = "")

# Line Plots: First change data format from wide to long with melt() from reshape2
# library(reshape2)
# CA <- melt(COSAMA, id.vars = "subject", variable.name = "treatment",
# value.count = "VO2")
# ggplot(data = CA, aes(x = subject, y = value, color = treatment)) + geom_line()
# rm(CA)
# Convert to long format with reshape()
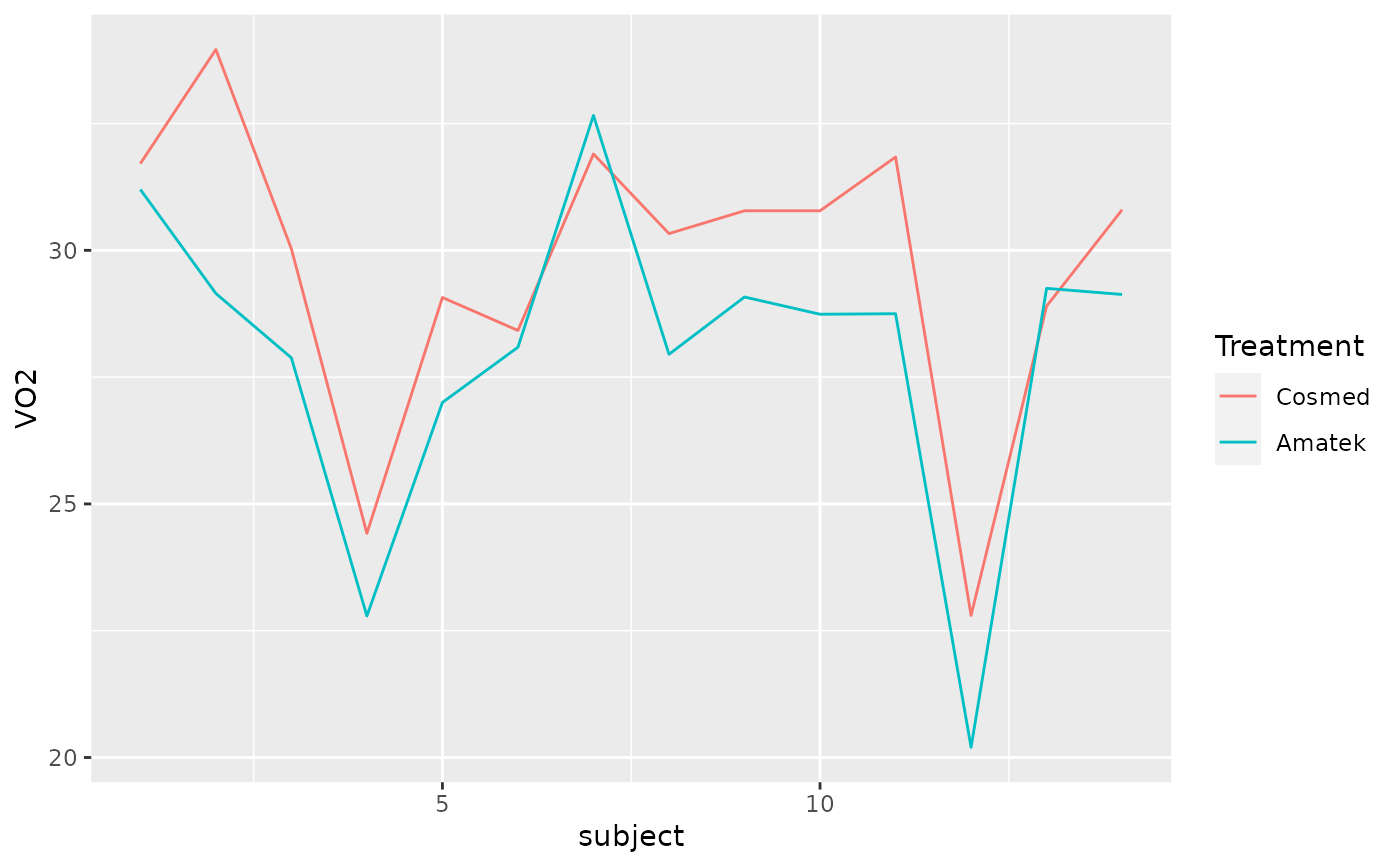
CA <- reshape(COSAMA, varying = c("cosmed", "amatek"), v.names = "VO2",
timevar = "treatment", idvar = "subject", direction = "long")
ggplot(data = CA, aes(x = subject, y = VO2, color = factor(treatment))) + geom_line() +
labs(color = "Treatment") + scale_color_discrete(labels = c("Cosmed", "Amatek"))

rm(CA)
# lattice approach
bwplot(~ (cosmed - amatek), data = COSAMA)
