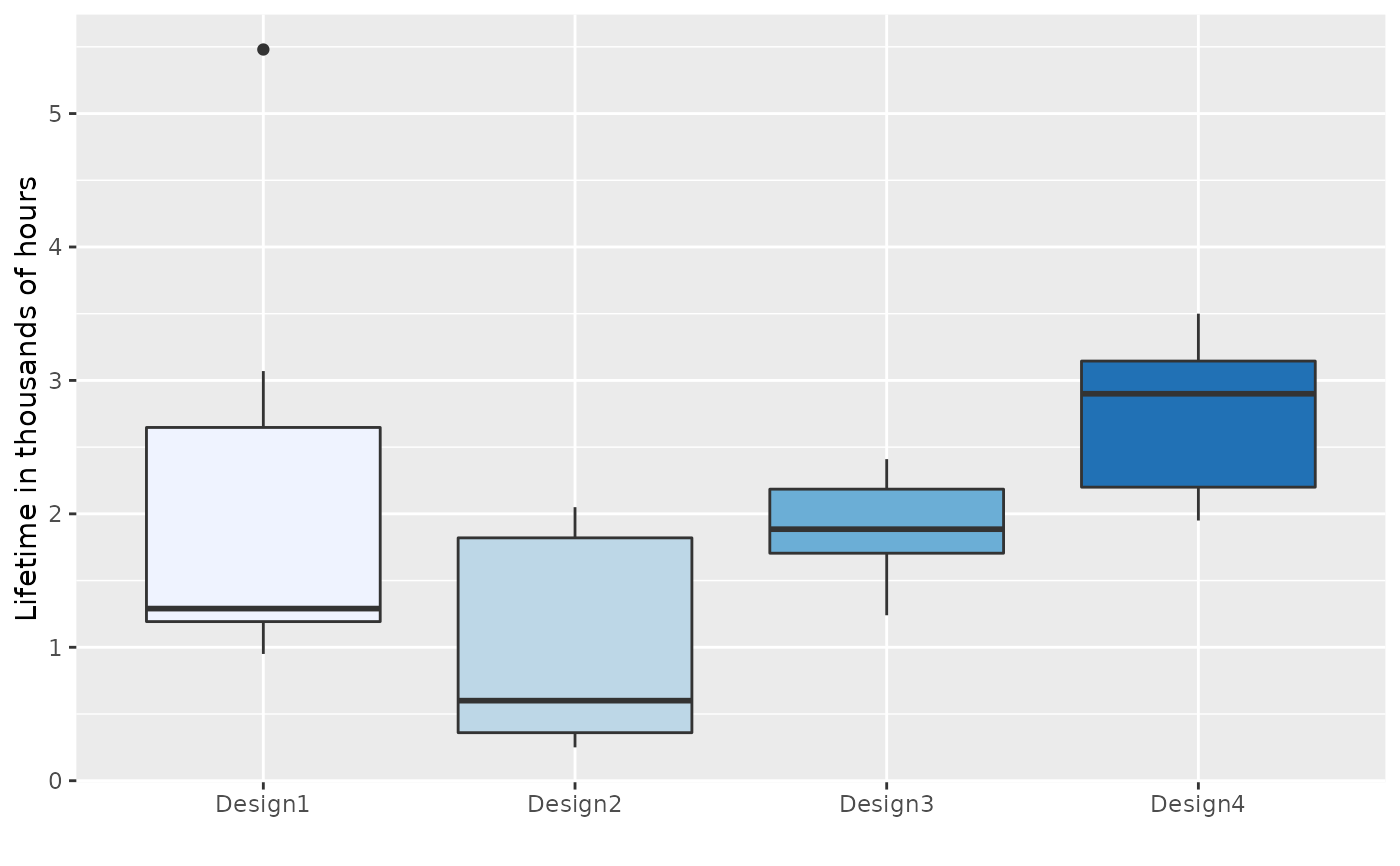
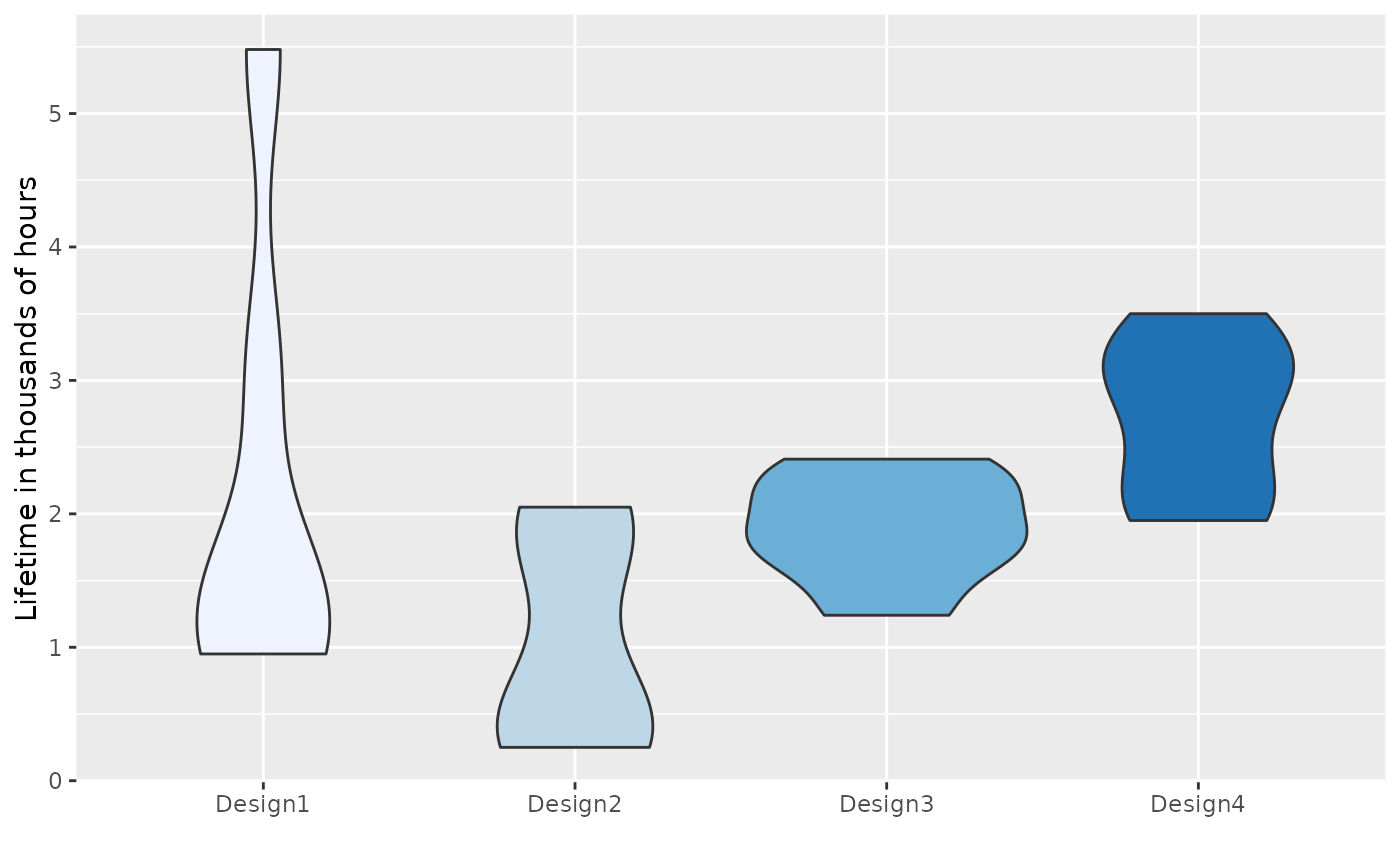
Results from an accelerated life test used to estimate the lifetime of four different circuit designs (lifetimes in thousands of hours)
CIRCUITFormat
A data frame with 26 observations on the following 2 variables:
lifetime(lifetimes in thousands of hours)design(a factor with levelsDesignIandDesignII)
References
Ugarte, M. D., Militino, A. F., and Arnholt, A. T. 2015. Probability and Statistics with R, Second Edition. Chapman & Hall / CRC.
Examples
# ggplot2 approach
ggplot(data = CIRCUIT, aes(x = design, y = lifetime, fill = design)) + geom_boxplot() +
labs(x = "", y = "Lifetime in thousands of hours") + guides(fill = "none") +
scale_fill_brewer()
 ggplot(data = CIRCUIT, aes(x = design, y = lifetime, fill = design)) + geom_violin() +
labs(x = "", y = "Lifetime in thousands of hours") + guides(fill = "none") +
scale_fill_brewer()
ggplot(data = CIRCUIT, aes(x = design, y = lifetime, fill = design)) + geom_violin() +
labs(x = "", y = "Lifetime in thousands of hours") + guides(fill = "none") +
scale_fill_brewer()
 # Reorder the boxplots by medians
ggplot(data = CIRCUIT, aes(x = reorder(design, lifetime, FUN = median), lifetime,
fill = design)) + geom_boxplot() + labs(x = "", y = "Lifetime in thousands of hours") +
guides(fill = "none") + scale_fill_brewer()
# Reorder the boxplots by medians
ggplot(data = CIRCUIT, aes(x = reorder(design, lifetime, FUN = median), lifetime,
fill = design)) + geom_boxplot() + labs(x = "", y = "Lifetime in thousands of hours") +
guides(fill = "none") + scale_fill_brewer()
