Values from a study reported in the American Journal of Clinical Nutrition that investigated a new method for measuring body composition
BODYFATFormat
A data frame with 18 observations on the following 3 variables:
age(age in years)fat(percent body fat composition)sex(a factor with levelsFfor female andMfor male)
Source
Mazess, R. B., Peppler, W. W., and Gibbons, M. (1984) “Total Body Composition by Dual-Photon (153 Gd) Absorptiometry.” American Journal of Clinical Nutrition, 40, 4: 834-839.
References
Ugarte, M. D., Militino, A. F., and Arnholt, A. T. 2015. Probability and Statistics with R, Second Edition. Chapman & Hall / CRC.
Examples
# base graphics
boxplot(fat ~ sex, data = BODYFAT)
 # ggplot2 approach
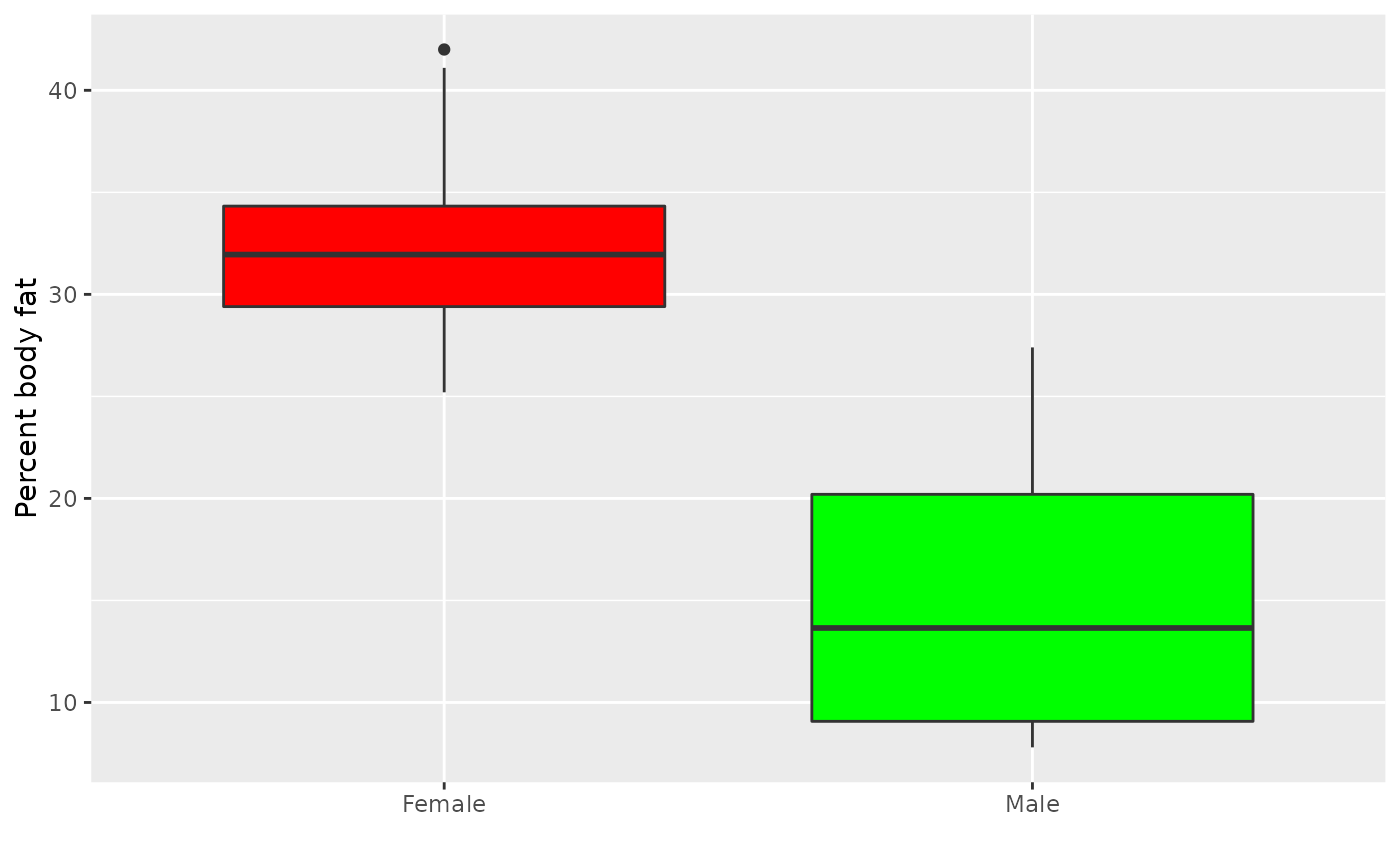
ggplot(data=BODYFAT, aes(x = sex, y = fat, fill = sex)) + geom_boxplot() +
labs(x = "",y = "Percent body fat") + scale_x_discrete(breaks=c("F", "M"),
labels =c("Female", "Male")) + guides(fill = "none") +
scale_fill_manual(values = c("red", "green"))
# ggplot2 approach
ggplot(data=BODYFAT, aes(x = sex, y = fat, fill = sex)) + geom_boxplot() +
labs(x = "",y = "Percent body fat") + scale_x_discrete(breaks=c("F", "M"),
labels =c("Female", "Male")) + guides(fill = "none") +
scale_fill_manual(values = c("red", "green"))
 # Brewer Colors
ggplot(data=BODYFAT, aes(x = sex, y = fat, fill = sex)) + geom_boxplot() +
labs(x = "", y = "Percent body fat") + scale_x_discrete(breaks=c("F", "M"),
labels =c("Female", "Male")) + guides(fill = "none") + scale_fill_brewer()
# Brewer Colors
ggplot(data=BODYFAT, aes(x = sex, y = fat, fill = sex)) + geom_boxplot() +
labs(x = "", y = "Percent body fat") + scale_x_discrete(breaks=c("F", "M"),
labels =c("Female", "Male")) + guides(fill = "none") + scale_fill_brewer()
 ggplot(data=BODYFAT, aes(x = fat, fill = sex)) + geom_density(alpha = 0.4) +
scale_fill_brewer()
ggplot(data=BODYFAT, aes(x = fat, fill = sex)) + geom_density(alpha = 0.4) +
scale_fill_brewer()
