A manufacturer of lithium batteries has two production facilities, A and B. Facility A batteries have an advertised life of 180 hours. Facility B batteries have an advertised life of 200 hours. Fifty randomly selected batteries from Facility A are selected and tested. Fifty randomly selected batteries from Facility B are selected and tested. The lifetimes for the tested batteries are stored in the variable lifetime.
BATTERYFormat
A data frame with 100 observations on the following two variables:
lifetime(life time measured in hours)facility(factorwith two levelsAandB)
References
Ugarte, M. D., Militino, A. F., and Arnholt, A. T. 2015. Probability and Statistics with R, Second Edition. Chapman & Hall / CRC.
Examples
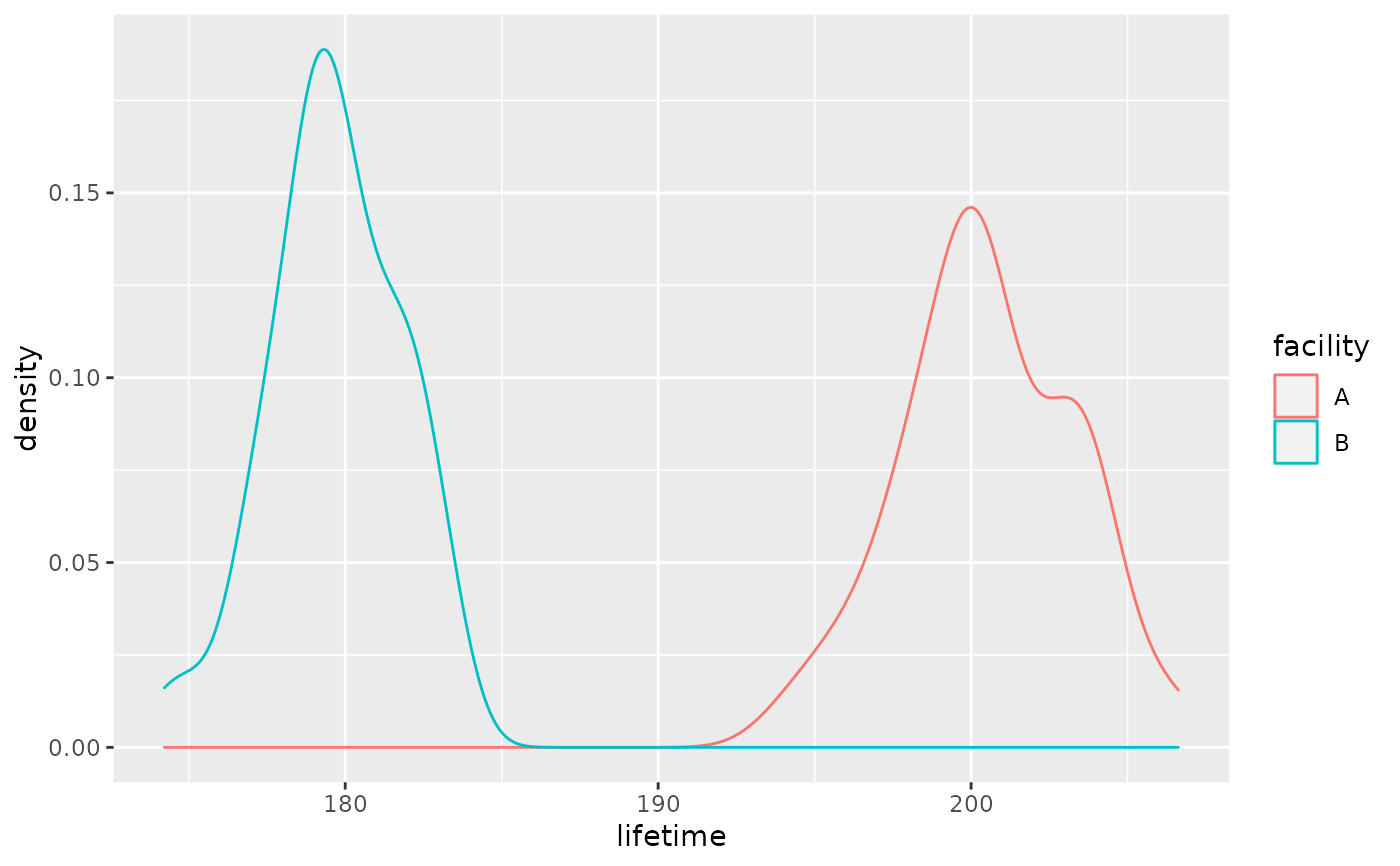
p <- ggplot(data = BATTERY, aes(x = lifetime, color = facility))
p + geom_density()
 q <- ggplot(data = BATTERY, aes(x = facility, y = lifetime))
q + geom_violin()
q <- ggplot(data = BATTERY, aes(x = facility, y = lifetime))
q + geom_violin()
 ggplot(data = BATTERY, aes(x = facility, y = lifetime, fill = facility)) +
geom_violin() + scale_fill_brewer() + guides(fill = "none")
ggplot(data = BATTERY, aes(x = facility, y = lifetime, fill = facility)) +
geom_violin() + scale_fill_brewer() + guides(fill = "none")
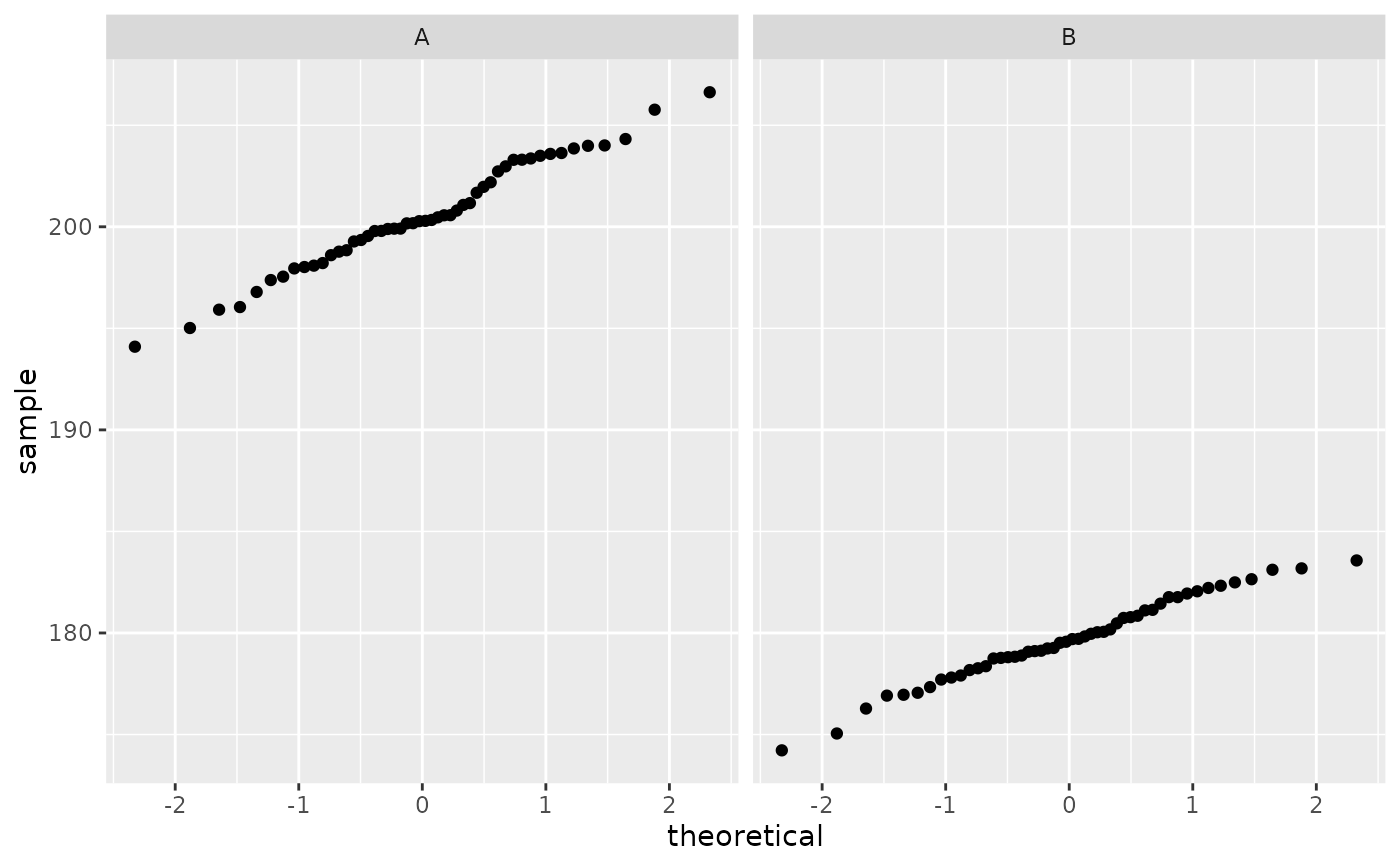
 ggplot(data = BATTERY, aes(sample = lifetime)) + stat_qq() + facet_grid(. ~ facility)
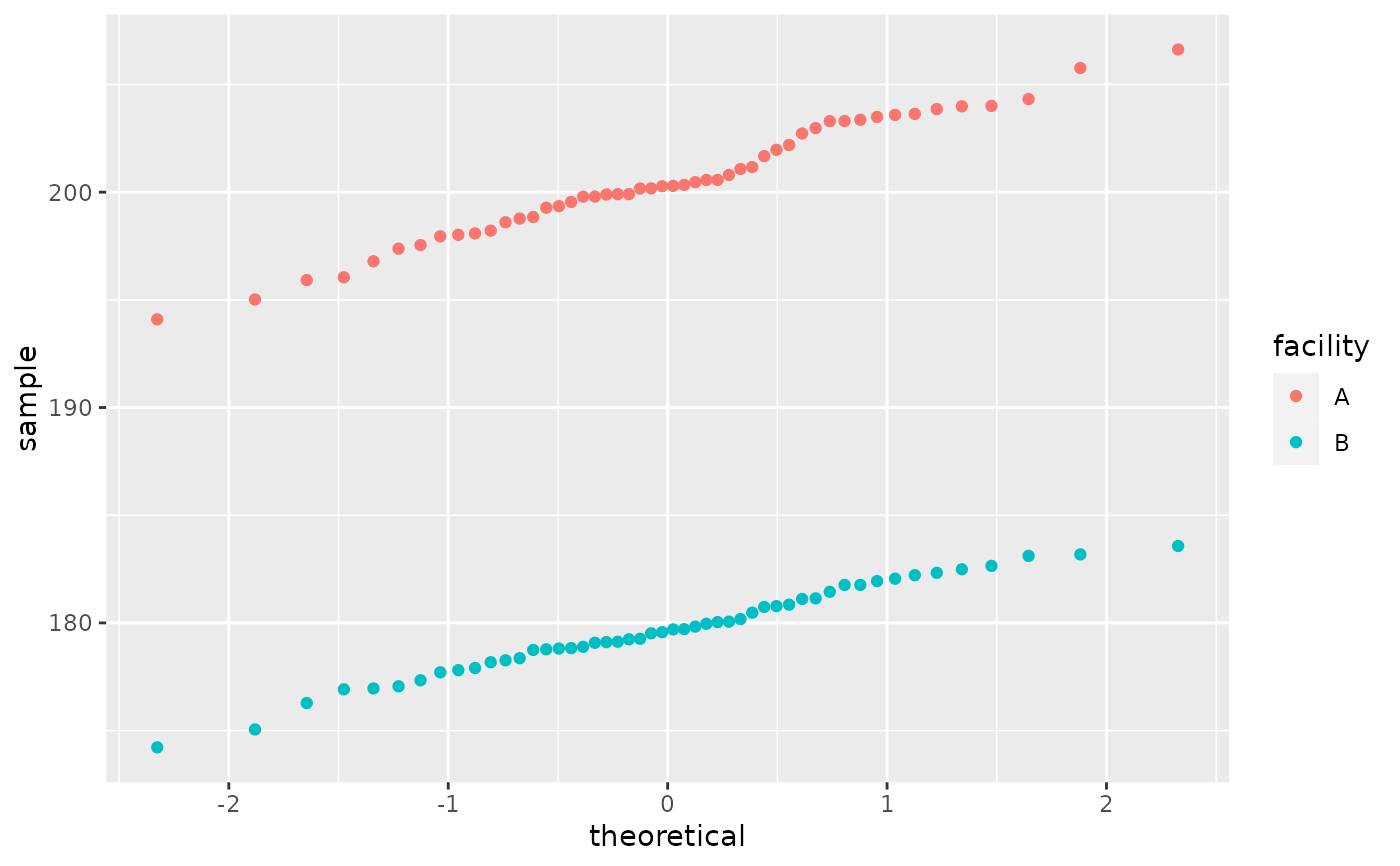
 ggplot(data = BATTERY, aes(sample = lifetime, color = facility)) + stat_qq()
 # lattice approach
qqmath(~ lifetime|facility, data = BATTERY)
# lattice approach
qqmath(~ lifetime|facility, data = BATTERY)
 qqmath(~ lifetime, group = facility, type = c('p', 'r'), auto.key=TRUE, data = BATTERY)
