An experiment was undertaken where seventeen apples were randomly selected from an orchard (fresh) and measured for hardness. Seventeen apples were also randomly selected from a warehouse (warehouse) where the apples had been stored for one week and measured for hardness.
APPLEFormat
A data frame with 34 observations on the following two variables:
hardness(hardness rating measured in \(\texttt{kg}/\texttt{meter}^2\) for both thefreshandwarehouseapples)location(factorwith two levelsfreshandwarehouse)
References
Ugarte, M. D., Militino, A. F., and Arnholt, A. T. 2015. Probability and Statistics with R, Second Edition. Chapman & Hall / CRC.
Examples
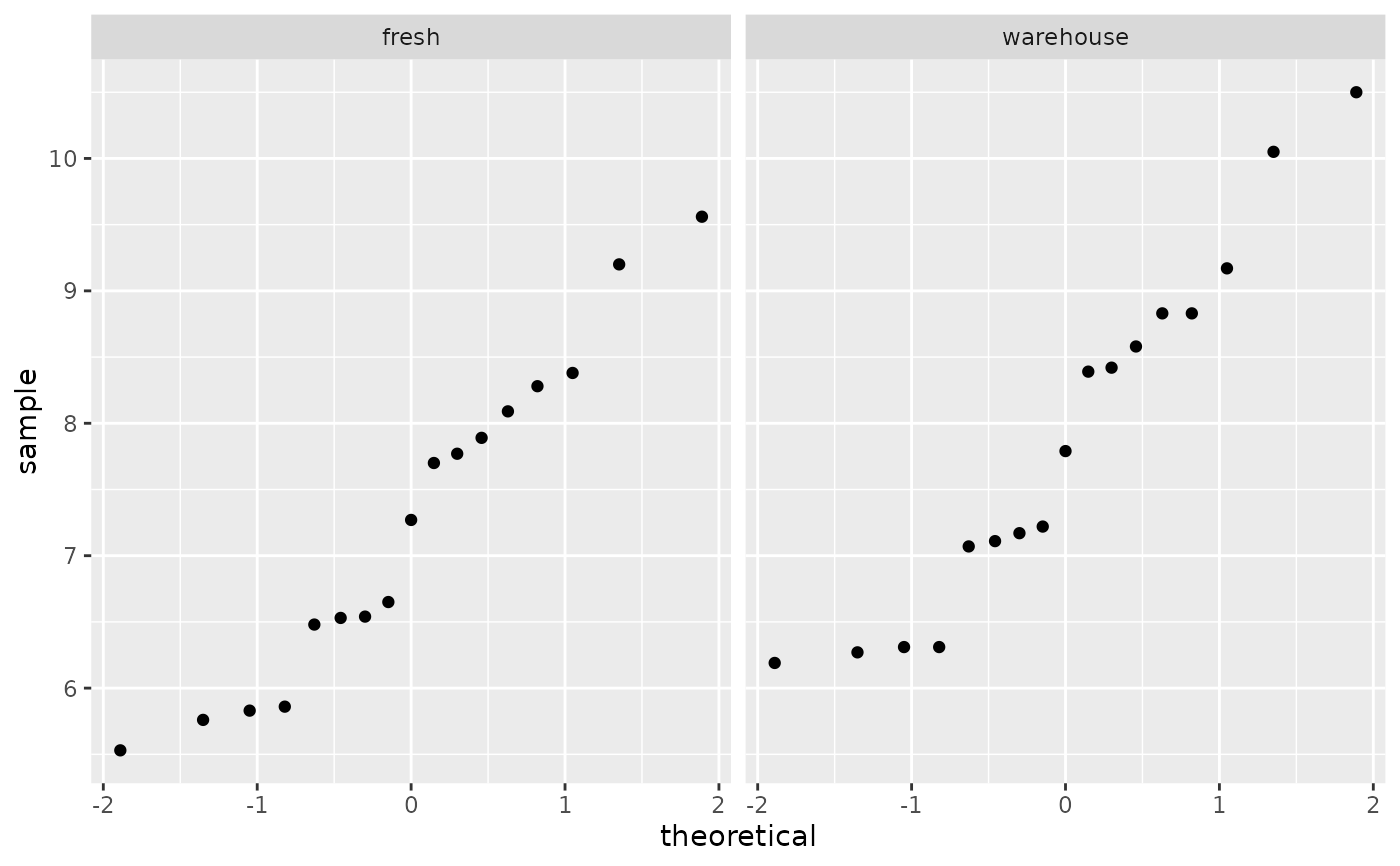
# ggplot2 approach
ggplot(data = APPLE, aes(sample = hardness)) + stat_qq() + facet_grid(. ~ location)
 ggplot(data = APPLE, aes(sample = hardness, color = location)) + stat_qq()
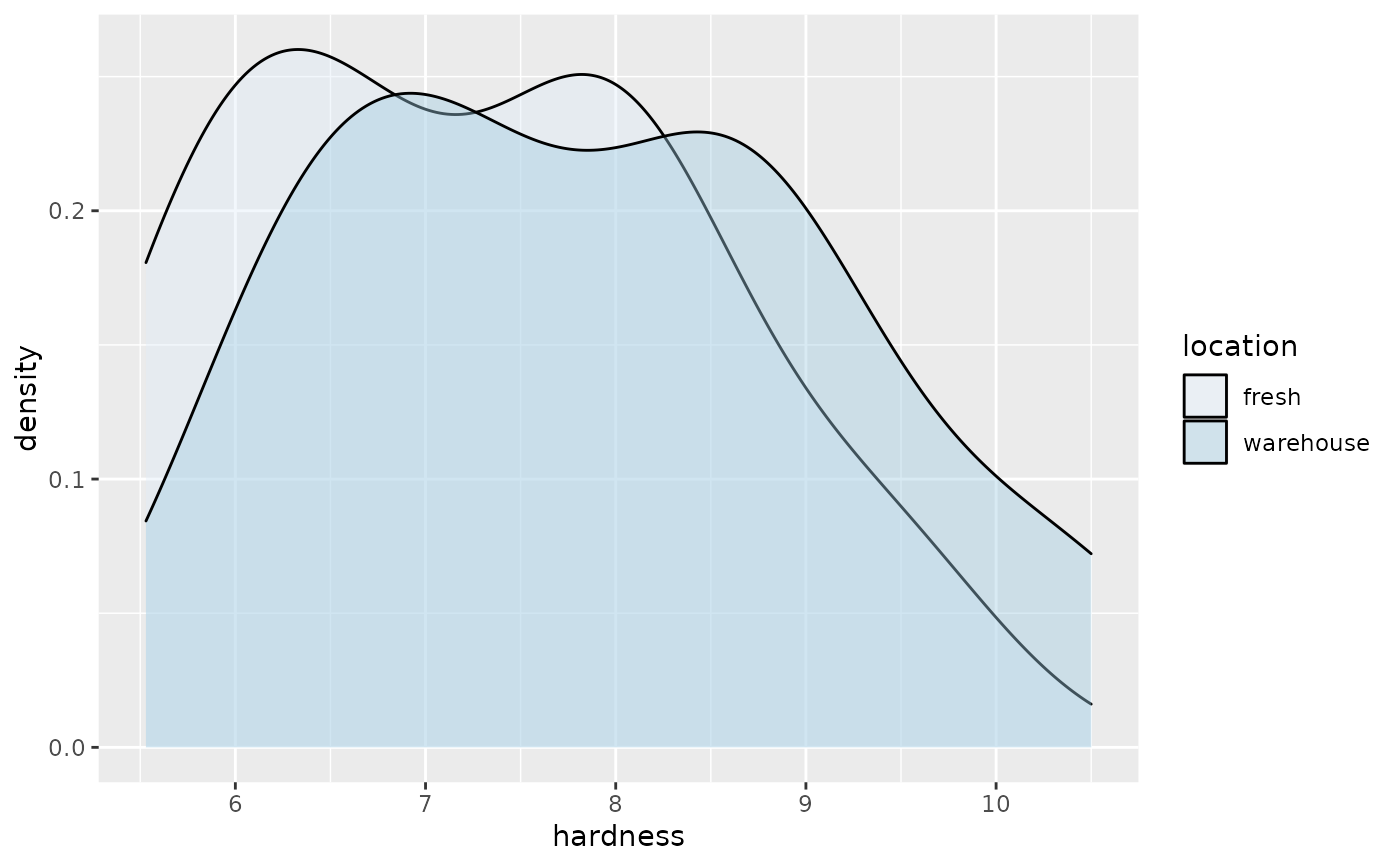
 ggplot(data = APPLE, aes(x = hardness, fill = location)) + geom_density(alpha = 0.4) +
scale_fill_brewer()
ggplot(data = APPLE, aes(x = hardness, fill = location)) + geom_density(alpha = 0.4) +
scale_fill_brewer()
 # lattice approach
qqmath(~hardness|location, data = APPLE)
# lattice approach
qqmath(~hardness|location, data = APPLE)
 qqmath(~hardness, group = location, type = c('p', 'r'), auto.key = TRUE, data = APPLE)
