Exploratory Graphs for Single Factor Designs
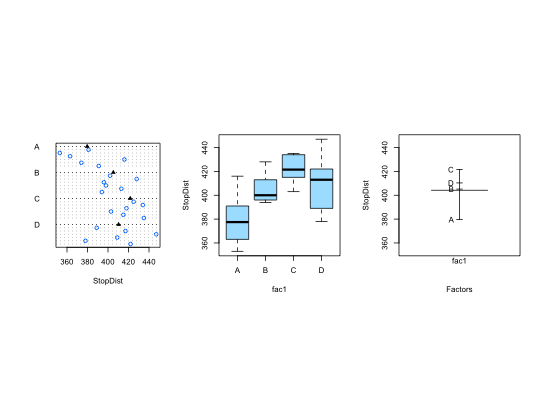
Function to create dotplots, boxplots, and design plot (means) for single factor designs
oneway.plots(Y, fac1, COL = c("#A9E2FF", "#0080FF"))
Arguments
| Y | response variable for a single factor design |
|---|---|
| fac1 | predictor variable |
| COL | a vector with two colors |
See also
Examples
with(data = Tire,
oneway.plots(StopDist, tire))