Checking Plots
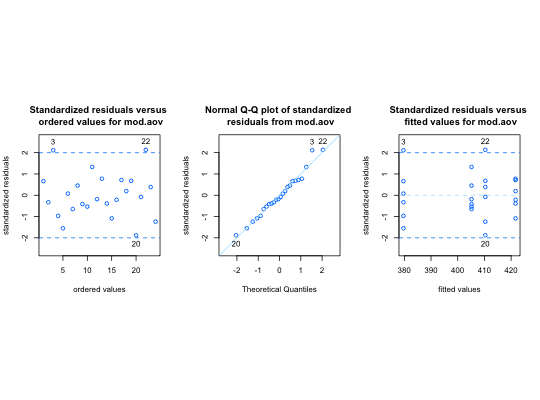
Function that creates the three graphs discussed in Sections 11.5.1, 11.5.2, and 11.5.3 that assesses independence, normality, and constant variance
checking.plots(model, n.id = 3, COL = c("#0080FF", "#A9E2FF"))
Arguments
| model | a linear model object |
|---|---|
| n.id | the number of points to identify |
| COL | vector of two colors |
Note
Requires package MASS.
See also
Examples
# Figure 11.10
mod.aov <- aov(StopDist~tire, data = Tire)
checking.plots(mod.aov)rm(mod.aov)
