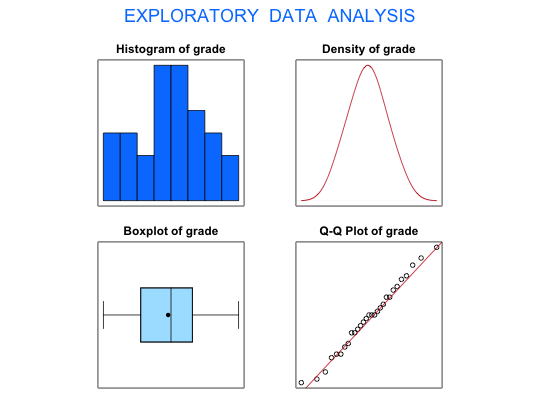
Statistics Grades
Test grades of 29 students taking a basic statistics course
Format
A data frame with 29 observations on the following variable:
- grade
test score
Source
Ugarte, M. D., Militino, A. F., and Arnholt, A. T. (2008) Probability and Statistics with R. Chapman & Hall/CRC.
Examples
#> [1] "grade"#> Size (n) Missing Minimum 1st Qu Mean Median TrMean 3rd Qu #> 29.000 0.000 57.000 67.500 75.207 76.000 75.148 82.000 #> Max. Stdev. Var. SE Mean I.Q.R. Range Kurtosis Skewness #> 95.000 9.901 98.027 1.839 14.500 38.000 -0.766 0.034 #> SW p-val #> 0.946
