Speed Detector
The Yonalasee tennis club has two systems to measure the speed of a tennis
ball. The local tennis pro suspects one system (Speed1) consistently records
faster speeds. To test her suspicions, she sets up both systems and records
the speeds of 12 serves (three serves from each side of the court). The
values are stored in the data frame Tennis in the variables
Speed1 and Speed2. The recorded speeds are in kilometers per
hour.
Format
A data frame with 12 observations on the following 2 variables:
- Speed1
speed in kilometers per hour
- Speed2
speed in kilometers per hour
Source
Ugarte, M. D., Militino, A. F., and Arnholt, A. T. (2008) Probability and Statistics with R. Chapman & Hall/CRC.
Examples
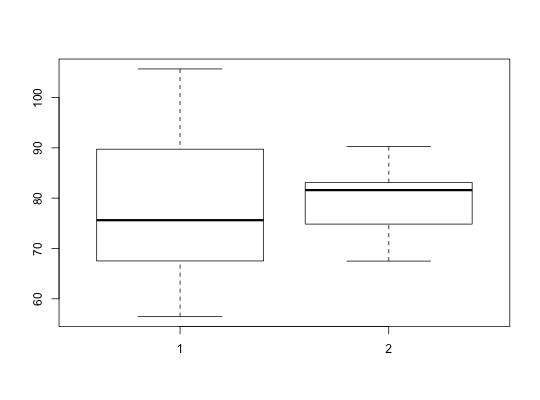
with(data = Tennis,
boxplot(Speed1, Speed2))
