Simulated Data (Predictors)
Simulated data for five variables. Data are used with Example 12.21.
Format
A data frame with 200 observations on the following 5 variables:
- Y1
a numeric vector
- Y2
a numeric vector
- x1
a numeric vector
- x2
a numeric vector
- x3
a numeric vector
Source
Ugarte, M. D., Militino, A. F., and Arnholt, A. T. (2008) Probability and Statistics with R. Chapman & Hall/CRC.
Examples
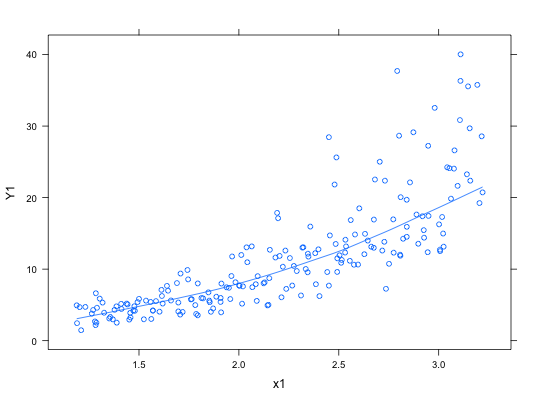
xyplot(Y1 ~ x1, data = SimDataST, type=c("p", "smooth"))
