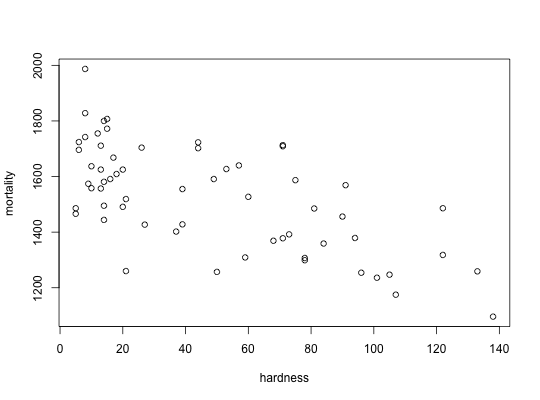
Mortality and Water Hardness
Mortality and drinking water hardness for 61 cities in England and Wales.
Format
A data frame with 61 observations on the following 4 variables.
- location
a factor with levels
NorthSouthindicating whether the town is as north as Derby- town
the name of the town
- mortality
averaged annual mortality per 100,000 males
- hardness
calcium concentration (in parts per million)
Source
D. J. Hand, F. Daly, A. D. Lunn, K. J. McConway and E. Ostrowski (1994) A Handbook of Small Datasets. Chapman and Hall/CRC, London.
Details
These data were collected in an investigation of environmental causes of disease. They show the annual mortality rate per 100,000 for males, averaged over the years 1958-1964, and the calcium concentration (in parts per million) in the drinking water supply for 61 large towns in England and Wales. (The higher the calcium concentration, the harder the water.)
Examples
plot(mortality ~ hardness, data = HardWater)
