Data for Exercise 1.30
Weather94Format
A data frame/tibble with 388 observations on one variable
- type
factor with levels
Extreme Temp,Flash Flood,Fog,High Wind,Hurricane,Lighting,Other,River Flood,Thunderstorm,Tornado, andWinter Weather
References
Kitchens, L. J. (2003) Basic Statistics and Data Analysis. Pacific Grove, CA: Brooks/Cole, a division of Thomson Learning.
Examples
T1 <- xtabs(~type, data = Weather94)
T1
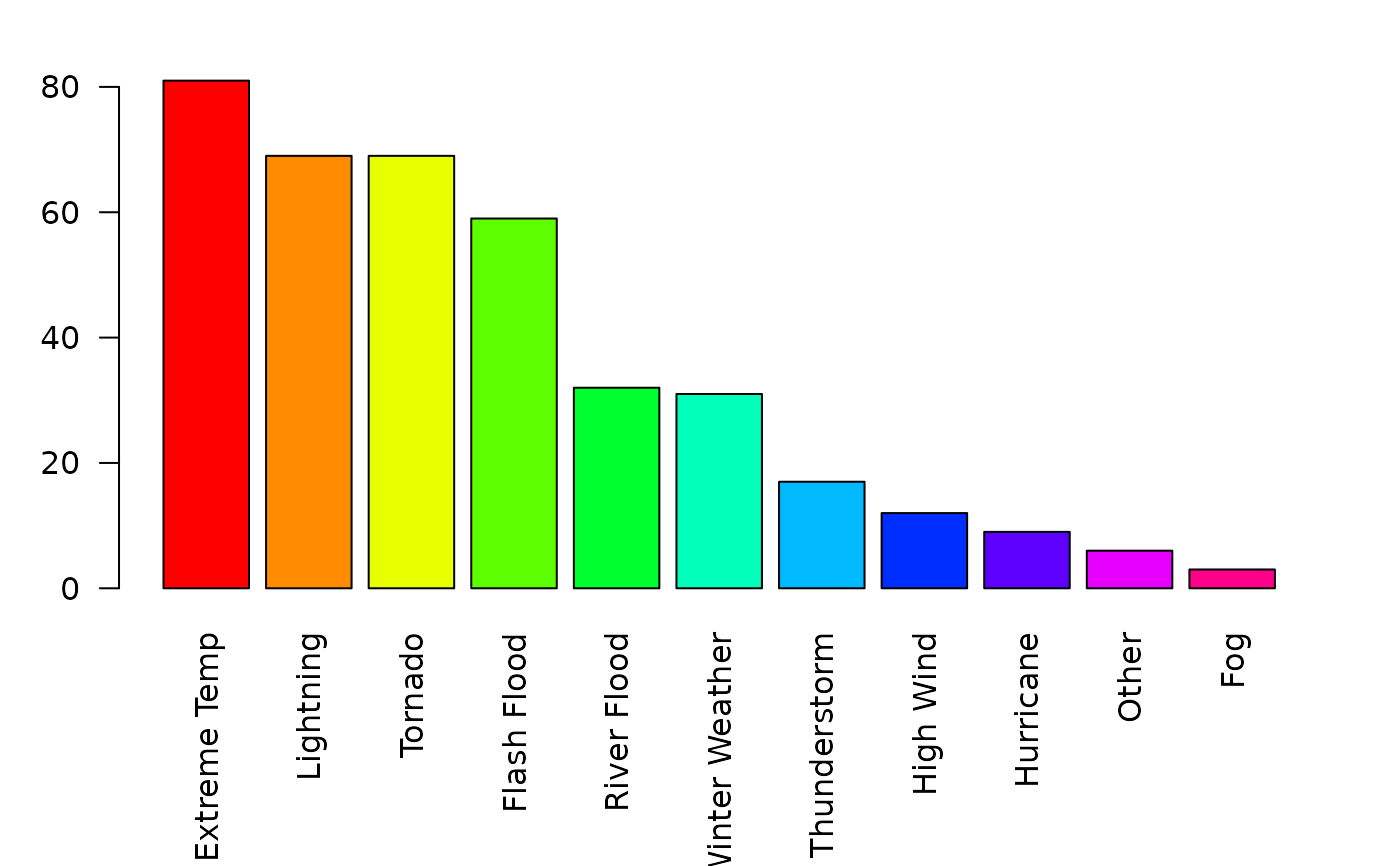
#> type
#> Extreme Temp Flash Flood Fog High Wind Hurricane
#> 81 59 3 12 9
#> Lightning Other River Flood Thunderstorm Tornado
#> 69 6 32 17 69
#> Winter Weather
#> 31
par(mar = c(5.1 + 2, 4.1 - 1, 4.1 - 2, 2.1))
barplot(sort(T1, decreasing = TRUE), las = 2, col = rainbow(11))
 par(mar = c(5.1, 4.1, 4.1, 2.1))
if (FALSE) {
library(ggplot2)
T2 <- as.data.frame(T1)
T2
ggplot2::ggplot(data =T2, aes(x = reorder(type, Freq), y = Freq)) +
geom_bar(stat = "identity", fill = "purple") +
theme_bw() +
theme(axis.text.x = element_text(angle = 55, vjust = 0.5)) +
labs(x = "", y = "count")
}
par(mar = c(5.1, 4.1, 4.1, 2.1))
if (FALSE) {
library(ggplot2)
T2 <- as.data.frame(T1)
T2
ggplot2::ggplot(data =T2, aes(x = reorder(type, Freq), y = Freq)) +
geom_bar(stat = "identity", fill = "purple") +
theme_bw() +
theme(axis.text.x = element_text(angle = 55, vjust = 0.5)) +
labs(x = "", y = "count")
}