Data for Exercise 7.44
ViscositFormat
A data frame/tibble with 11 observations on two variables
- first
viscosity measurement for a certain substance on day one
- second
viscosity measurement for a certain substance on day two
References
Kitchens, L. J. (2003) Basic Statistics and Data Analysis. Pacific Grove, CA: Brooks/Cole, a division of Thomson Learning.
Examples
boxplot(Viscosit$first, Viscosit$second, col = "blue")
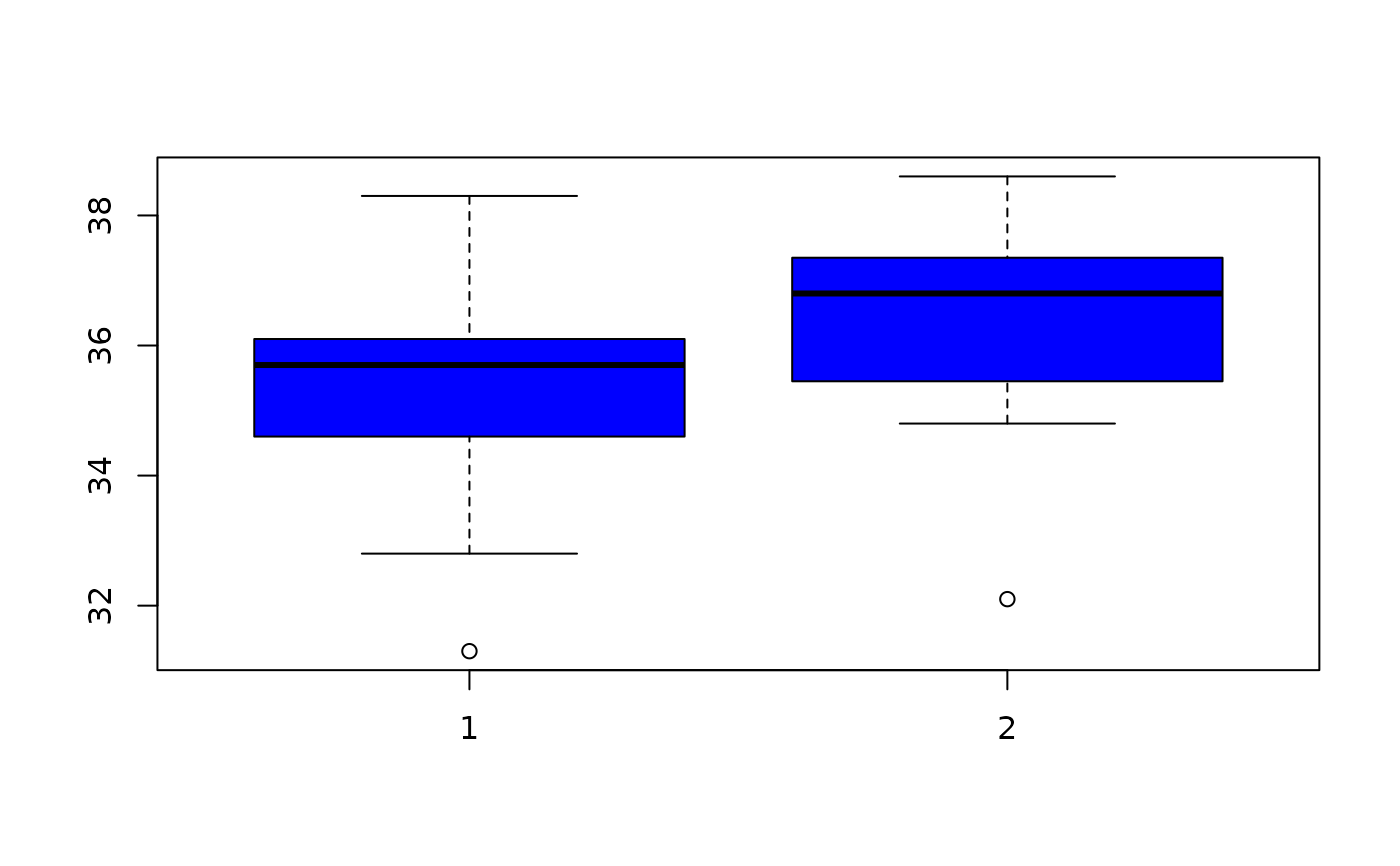 t.test(Viscosit$first, Viscosit$second, var.equal = TRUE)
#>
#> Two Sample t-test
#>
#> data: Viscosit$first and Viscosit$second
#> t = -1.2578, df = 20, p-value = 0.2229
#> alternative hypothesis: true difference in means is not equal to 0
#> 95 percent confidence interval:
#> -2.7067041 0.6703404
#> sample estimates:
#> mean of x mean of y
#> 35.28182 36.30000
#>
t.test(Viscosit$first, Viscosit$second, var.equal = TRUE)
#>
#> Two Sample t-test
#>
#> data: Viscosit$first and Viscosit$second
#> t = -1.2578, df = 20, p-value = 0.2229
#> alternative hypothesis: true difference in means is not equal to 0
#> 95 percent confidence interval:
#> -2.7067041 0.6703404
#> sample estimates:
#> mean of x mean of y
#> 35.28182 36.30000
#>