Data for Exercise 1.15
UndergradFormat
A data frame/tibble with 100 observations on six variables
- gender
character variable with values
FemaleandMale- major
college major
- class
college year group classification
- gpa
grade point average
- sat
Scholastic Assessment Test score
- drops
number of courses dropped
References
Kitchens, L. J. (2003) Basic Statistics and Data Analysis. Pacific Grove, CA: Brooks/Cole, a division of Thomson Learning.
Examples
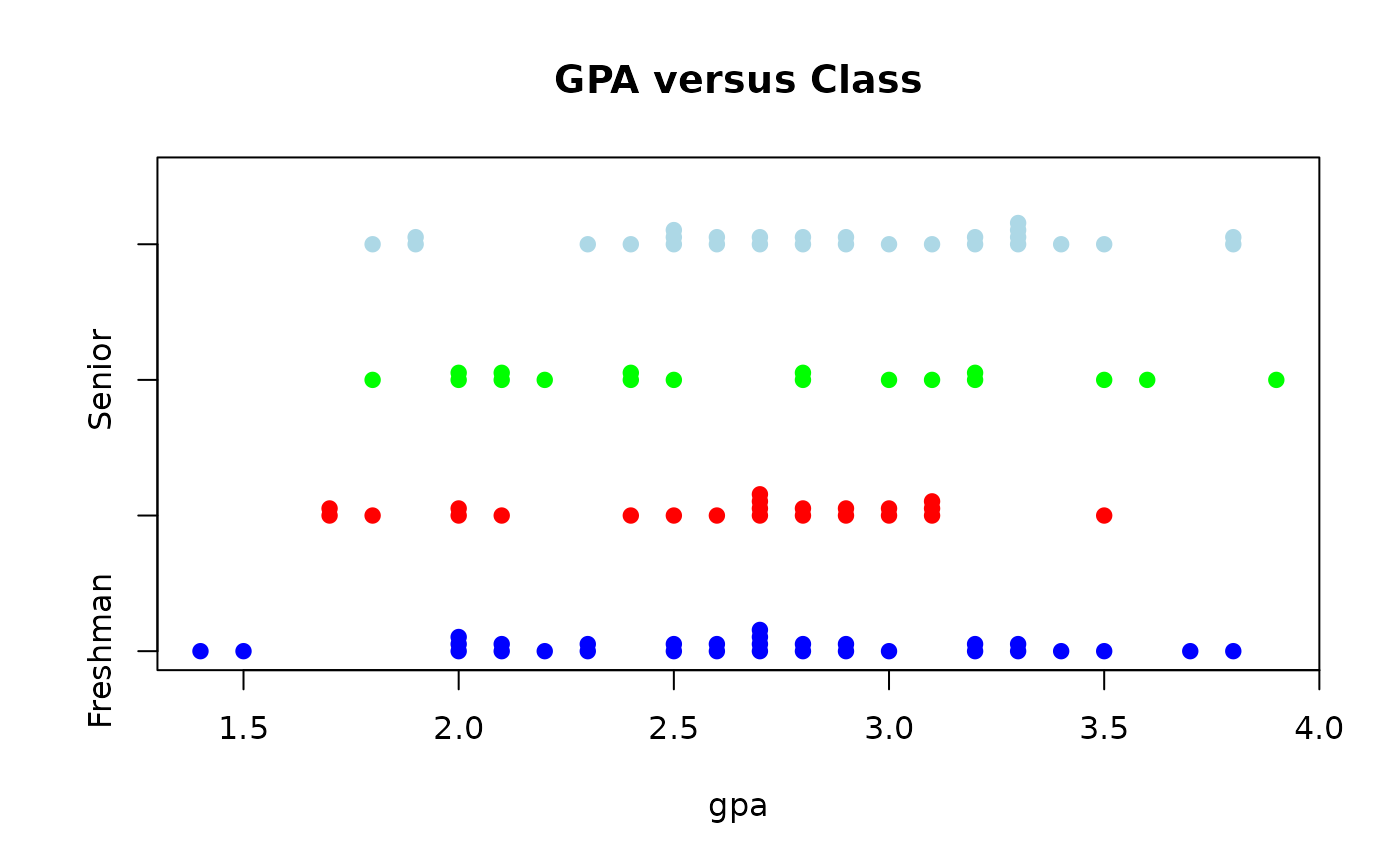
stripchart(gpa ~ class, data = Undergrad, method = "stack",
col = c("blue","red","green","lightblue"),
pch = 19, main = "GPA versus Class")
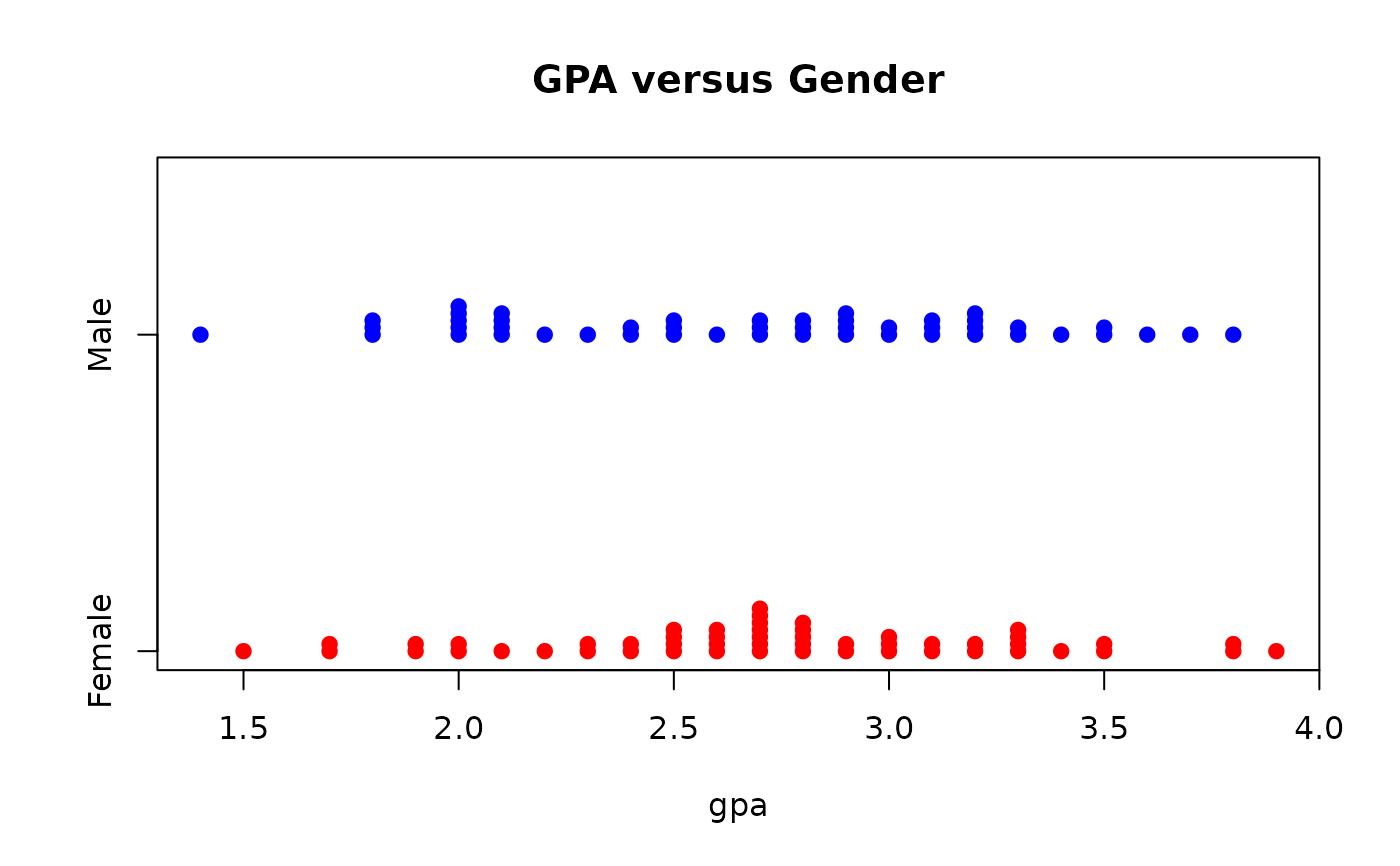
 stripchart(gpa ~ gender, data = Undergrad, method = "stack",
col = c("red", "blue"), pch = 19,
main = "GPA versus Gender")
stripchart(gpa ~ gender, data = Undergrad, method = "stack",
col = c("red", "blue"), pch = 19,
main = "GPA versus Gender")
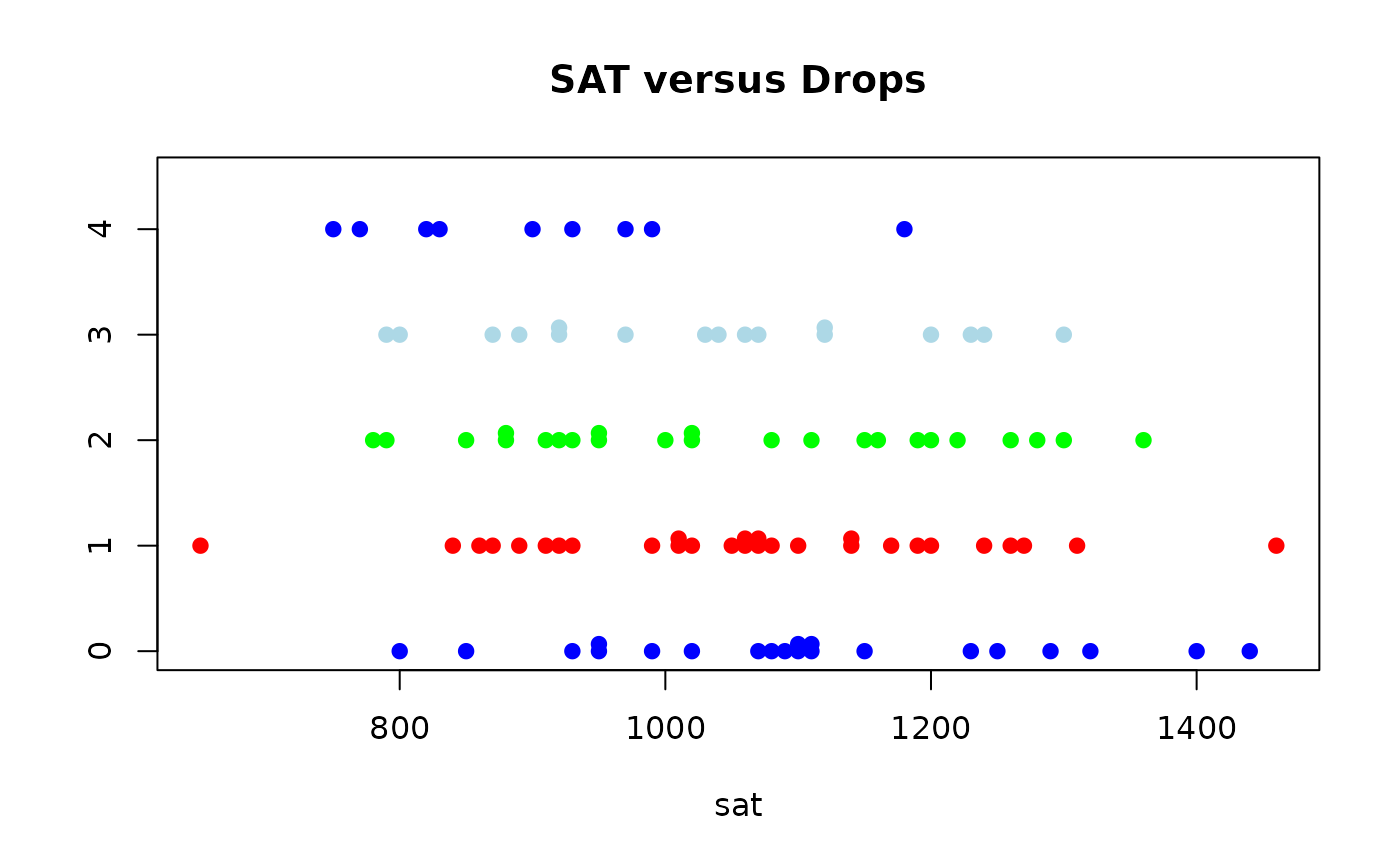
 stripchart(sat ~ drops, data = Undergrad, method = "stack",
col = c("blue", "red", "green", "lightblue"),
pch = 19, main = "SAT versus Drops")
stripchart(sat ~ drops, data = Undergrad, method = "stack",
col = c("blue", "red", "green", "lightblue"),
pch = 19, main = "SAT versus Drops")
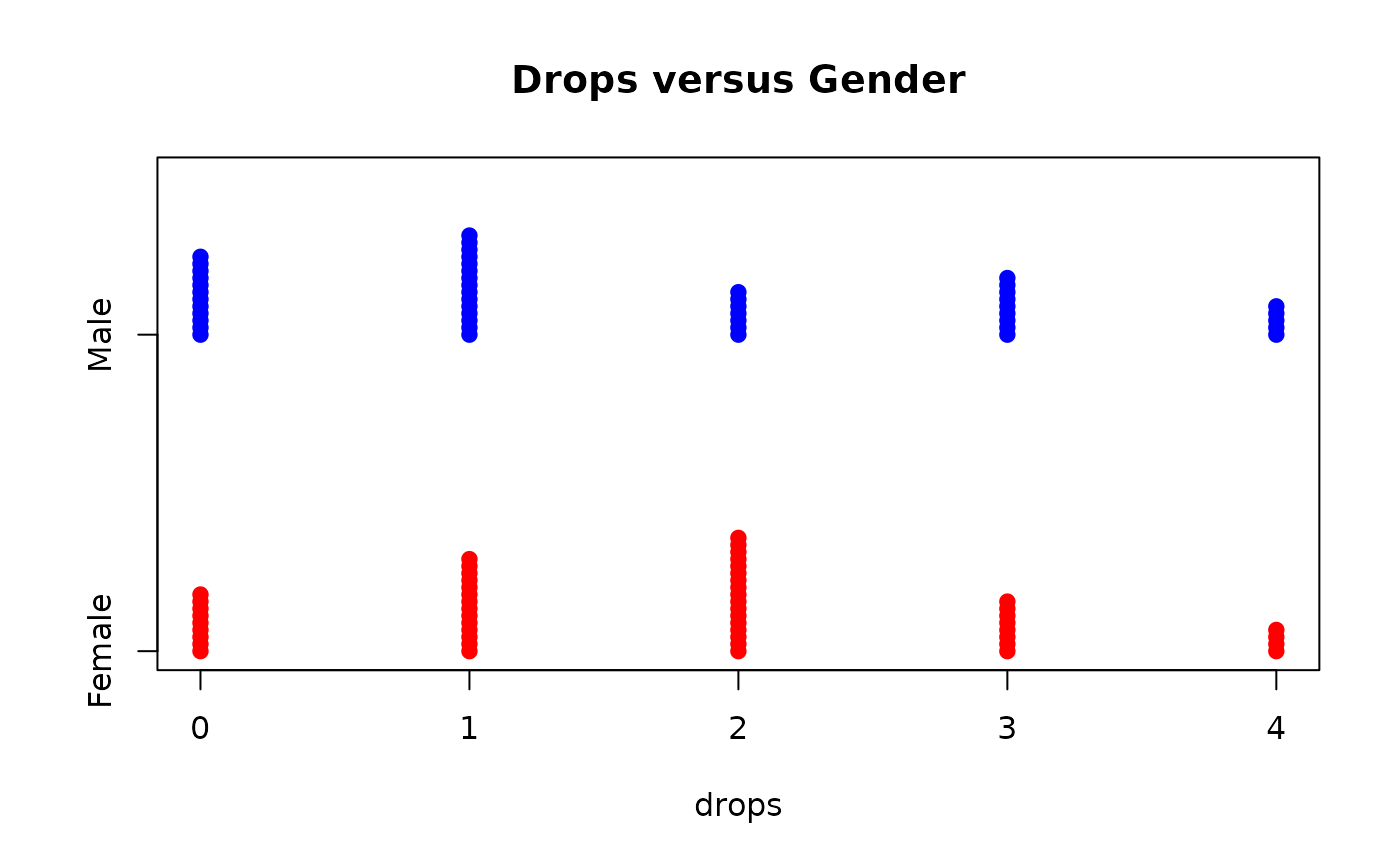
 stripchart(drops ~ gender, data = Undergrad, method = "stack",
col = c("red", "blue"), pch = 19, main = "Drops versus Gender")
stripchart(drops ~ gender, data = Undergrad, method = "stack",
col = c("red", "blue"), pch = 19, main = "Drops versus Gender")
 if (FALSE) {
library(ggplot2)
ggplot2::ggplot(data = Undergrad, aes(x = sat, y = drops, fill = factor(drops))) +
facet_grid(drops ~.) +
geom_dotplot() +
guides(fill = FALSE)
}
if (FALSE) {
library(ggplot2)
ggplot2::ggplot(data = Undergrad, aes(x = sat, y = drops, fill = factor(drops))) +
facet_grid(drops ~.) +
geom_dotplot() +
guides(fill = FALSE)
}