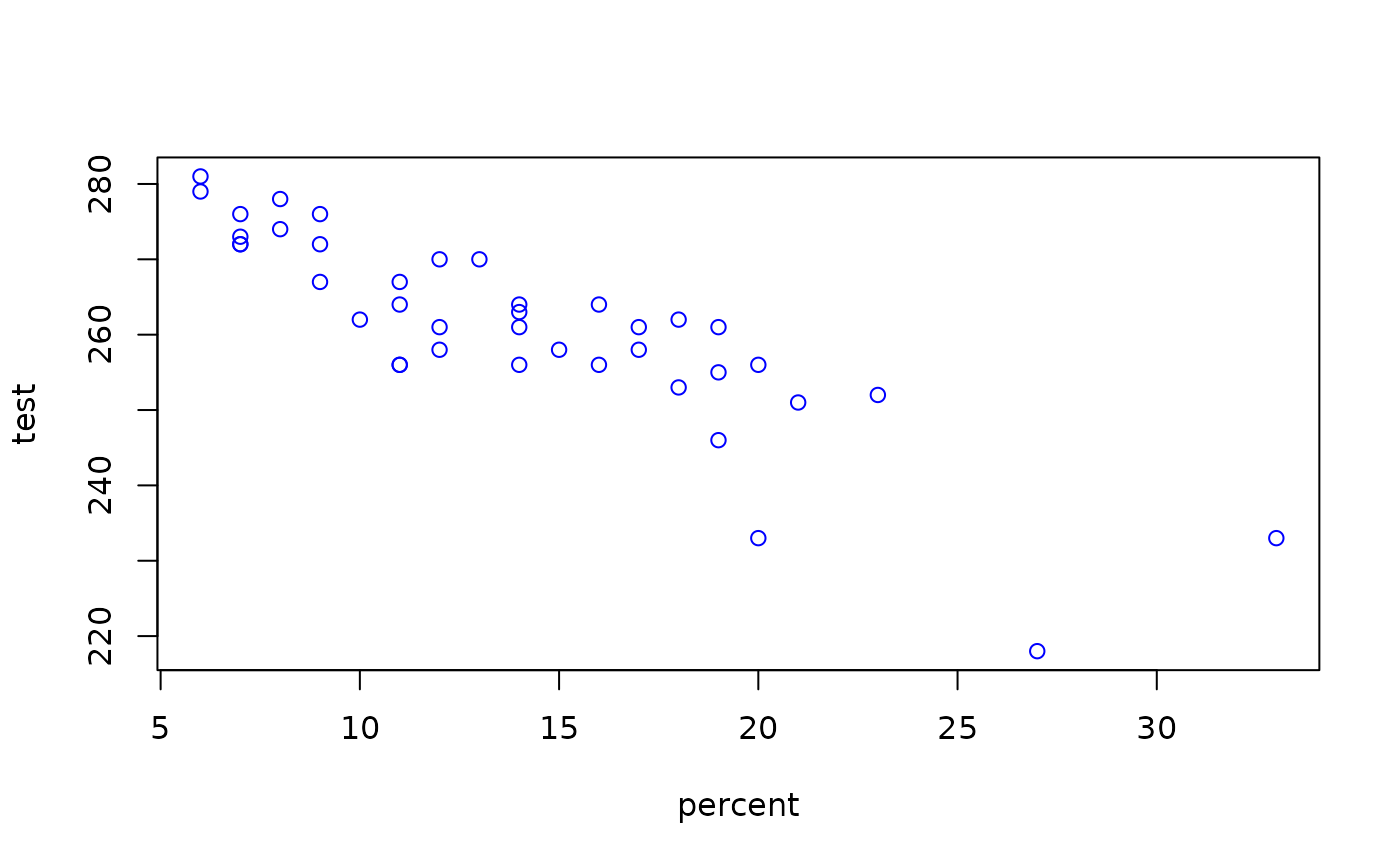
Percent of students that watch more than 6 hours of TV per day versus national math test scores
Source:R/BSDA-package.R
Tv.RdData for Examples 2.1 and 2.7
TvFormat
A data frame/tibble with 53 observations on three variables
- state
U.S. state
- percent
percent of students who watch more than six hours of TV a day
- test
state average on national math test
Source
Educational Testing Services.
References
Kitchens, L. J. (2003) Basic Statistics and Data Analysis. Pacific Grove, CA: Brooks/Cole, a division of Thomson Learning.