Data for Exercise 2.78
TonsilsFormat
A data frame/tibble with 1,398 observations on two variables
- size
a factor with levels
Normal,Large, andVery Large- status
a factor with levels
CarrierandNon-carrier
References
Kitchens, L. J. (2003) Basic Statistics and Data Analysis. Pacific Grove, CA: Brooks/Cole, a division of Thomson Learning.
Examples
T1 <- xtabs(~size + status, data = Tonsils)
T1
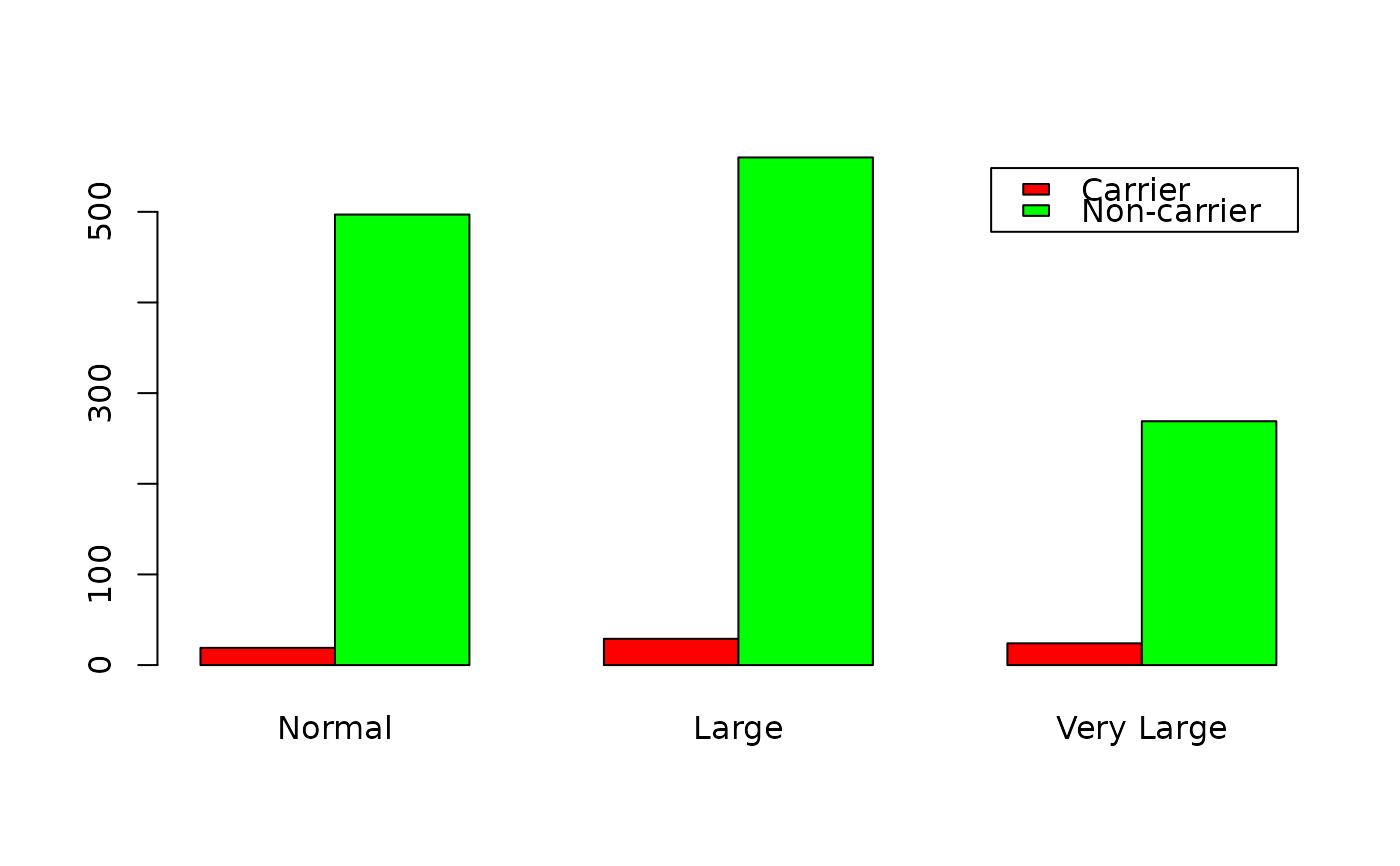
#> status
#> size Carrier Non-carrier
#> Normal 19 497
#> Large 29 560
#> Very Large 24 269
prop.table(T1, 1)
#> status
#> size Carrier Non-carrier
#> Normal 0.03682171 0.96317829
#> Large 0.04923599 0.95076401
#> Very Large 0.08191126 0.91808874
prop.table(T1, 1)[2, 1]
#> [1] 0.04923599
barplot(t(T1), legend = TRUE, beside = TRUE, col = c("red", "green"))
 if (FALSE) {
library(dplyr)
library(ggplot2)
NDF <- dplyr::count(Tonsils, size, status)
ggplot2::ggplot(data = NDF, aes(x = size, y = n, fill = status)) +
geom_bar(stat = "identity", position = "dodge") +
scale_fill_manual(values = c("red", "green")) +
theme_bw()
}
if (FALSE) {
library(dplyr)
library(ggplot2)
NDF <- dplyr::count(Tonsils, size, status)
ggplot2::ggplot(data = NDF, aes(x = size, y = n, fill = status)) +
geom_bar(stat = "identity", position = "dodge") +
scale_fill_manual(values = c("red", "green")) +
theme_bw()
}