Consumer Reports (Oct 94) rating of toaster ovens versus the cost
Source:R/BSDA-package.R
Toaster.RdData for Exercise 9.36
ToasterFormat
A data frame/tibble with 17 observations on three variables
- toaster
name of toaster
- score
Consumer Reports score
- cost
price of toaster (in dollars)
Source
Consumer Reports (October 1994).
References
Kitchens, L. J. (2003) Basic Statistics and Data Analysis. Pacific Grove, CA: Brooks/Cole, a division of Thomson Learning.
Examples
plot(cost ~ score, data = Toaster)

model <- lm(cost ~ score, data = Toaster)
summary(model)
#>
#> Call:
#> lm(formula = cost ~ score, data = Toaster)
#>
#> Residuals:
#>     Min      1Q  Median      3Q     Max
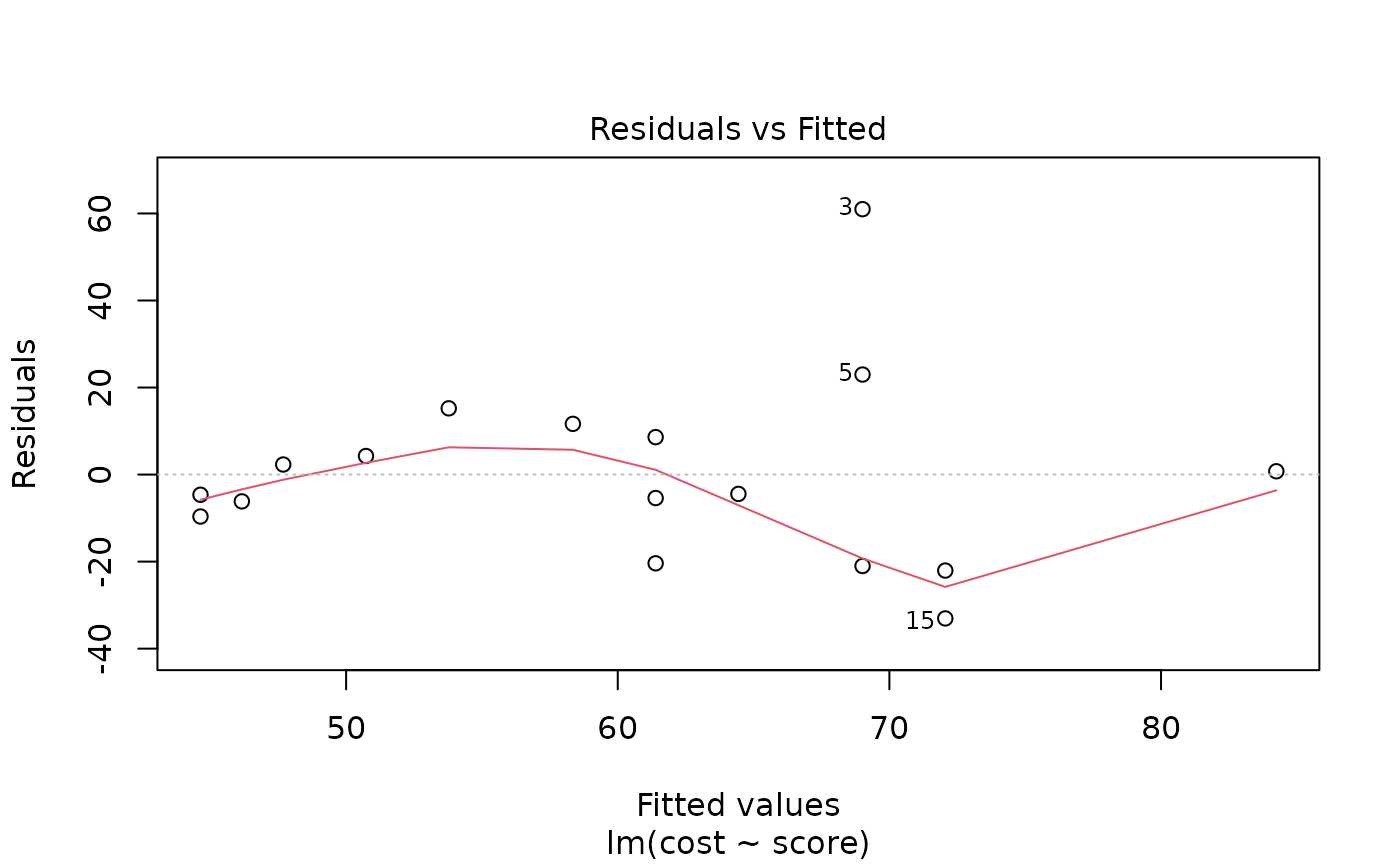
#> -33.058  -9.638  -4.441   8.605  60.989
#>
#> Coefficients:
#>             Estimate Std. Error t value Pr(>|t|)
#> (Intercept) -45.2373    51.5966  -0.877    0.394
#> score         1.5233     0.7387   2.062    0.057 .
#> ---
#> Signif. codes:  0 ‘***’ 0.001 ‘**’ 0.01 ‘*’ 0.05 ‘.’ 0.1 ‘ ’ 1
#>
#> Residual standard error: 22.14 on 15 degrees of freedom
#> Multiple R-squared:  0.2209,	Adjusted R-squared:  0.1689
#> F-statistic: 4.253 on 1 and 15 DF,  p-value: 0.05695
#>
names(summary(model))
#>  [1] "call"          "terms"         "residuals"     "coefficients"
#>  [5] "aliased"       "sigma"         "df"            "r.squared"
#>  [9] "adj.r.squared" "fstatistic"    "cov.unscaled"
summary(model)$r.squared
#> [1] 0.2208897
plot(model, which = 1)
