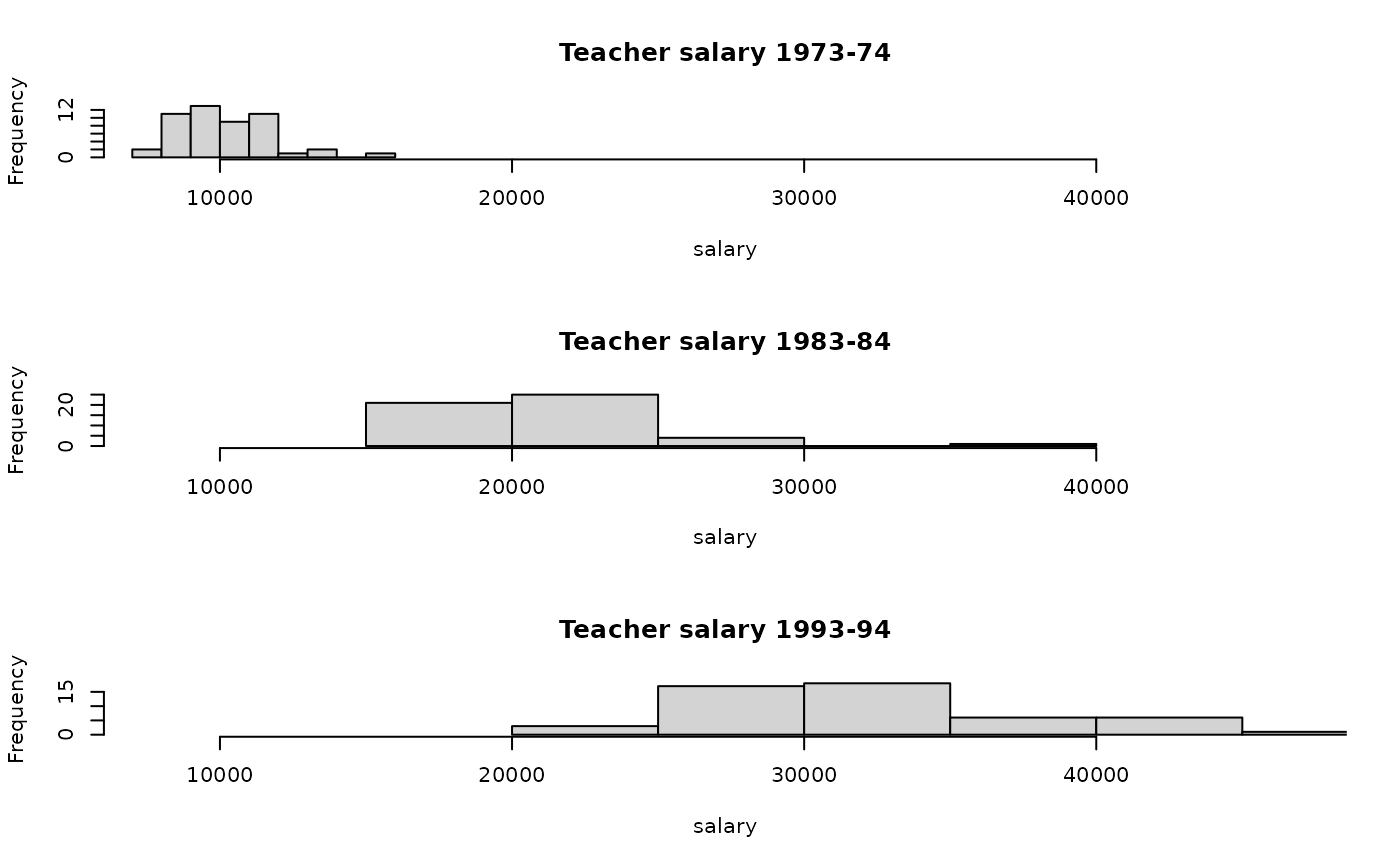
Average teacher's salaries across the states in the 70s 80s and 90s
Source:R/BSDA-package.R
Teacher.RdData for Exercise 5.114
TeacherFormat
A data frame/tibble with 51 observations on three variables
- state
U.S. state
- year
academic year
- salary
avaerage salary (in dollars)
Source
National Education Association.
References
Kitchens, L. J. (2003) Basic Statistics and Data Analysis. Pacific Grove, CA: Brooks/Cole, a division of Thomson Learning.
Examples
par(mfrow = c(3, 1))
hist(Teacher$salary[Teacher$year == "1973-74"],
     main = "Teacher salary 1973-74", xlab = "salary",
     xlim = range(Teacher$salary, na.rm = TRUE))
hist(Teacher$salary[Teacher$year == "1983-84"],
     main = "Teacher salary 1983-84", xlab = "salary",
     xlim = range(Teacher$salary, na.rm = TRUE))
hist(Teacher$salary[Teacher$year == "1993-94"],
     main = "Teacher salary 1993-94", xlab = "salary",
     xlim = range(Teacher$salary, na.rm = TRUE))

par(mfrow = c(1, 1))
if (FALSE) {
library(ggplot2)
    ggplot2::ggplot(data = Teacher, aes(x = salary)) +
               geom_histogram(fill = "purple", color = "black") +
               facet_grid(year ~ .) +
               theme_bw()
}
par(mfrow = c(1, 1))
if (FALSE) {
library(ggplot2)
ggplot2::ggplot(data = Teacher, aes(x = salary)) +
geom_histogram(fill = "purple", color = "black") +
facet_grid(year ~ .) +
theme_bw()
}