Data for Exercise 5.63
TablrockFormat
A data frame/tibble with 719 observations on the following 17 variables.
- day
date
- hour
time of day
- ozone
ozone concentration
- tmp
temperature (in Celcius)
- vdc
a numeric vector
- wd
a numeric vector
- ws
a numeric vector
- amb
a numeric vector
- dew
a numeric vector
- so2
a numeric vector
- no
a numeric vector
- no2
a numeric vector
- nox
a numeric vector
- co
a numeric vector
- co2
a numeric vector
- gas
a numeric vector
- air
a numeric vector
References
Kitchens, L. J. (2003) Basic Statistics and Data Analysis. Pacific Grove, CA: Brooks/Cole, a division of Thomson Learning.
Examples
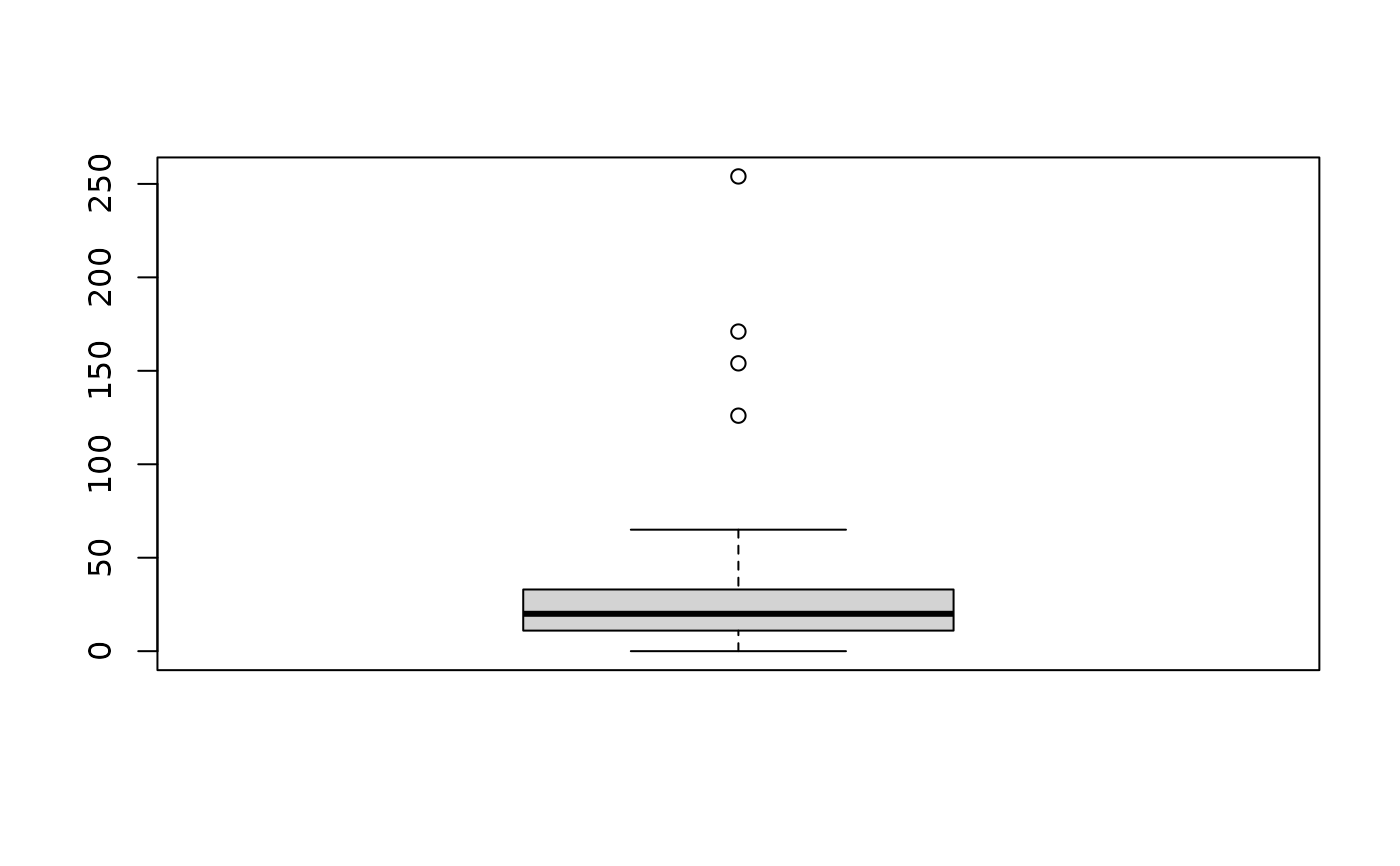
summary(Tablrock$ozone)
#> Min. 1st Qu. Median Mean 3rd Qu. Max. NA's
#> 0.00 11.00 20.00 23.69 33.00 254.00 90
boxplot(Tablrock$ozone)
 qqnorm(Tablrock$ozone)
qqline(Tablrock$ozone)
qqnorm(Tablrock$ozone)
qqline(Tablrock$ozone)
 par(mar = c(5.1 - 1, 4.1 + 2, 4.1 - 2, 2.1))
boxplot(ozone ~ day, data = Tablrock,
horizontal = TRUE, las = 1, cex.axis = 0.7)
par(mar = c(5.1 - 1, 4.1 + 2, 4.1 - 2, 2.1))
boxplot(ozone ~ day, data = Tablrock,
horizontal = TRUE, las = 1, cex.axis = 0.7)
 par(mar = c(5.1, 4.1, 4.1, 2.1))
if (FALSE) {
library(ggplot2)
ggplot2::ggplot(data = Tablrock, aes(sample = ozone)) +
geom_qq() +
theme_bw()
ggplot2::ggplot(data = Tablrock, aes(x = as.factor(day), y = ozone)) +
geom_boxplot(fill = "pink") +
coord_flip() +
labs(x = "") +
theme_bw()
}
par(mar = c(5.1, 4.1, 4.1, 2.1))
if (FALSE) {
library(ggplot2)
ggplot2::ggplot(data = Tablrock, aes(sample = ozone)) +
geom_qq() +
theme_bw()
ggplot2::ggplot(data = Tablrock, aes(x = as.factor(day), y = ozone)) +
geom_boxplot(fill = "pink") +
coord_flip() +
labs(x = "") +
theme_bw()
}