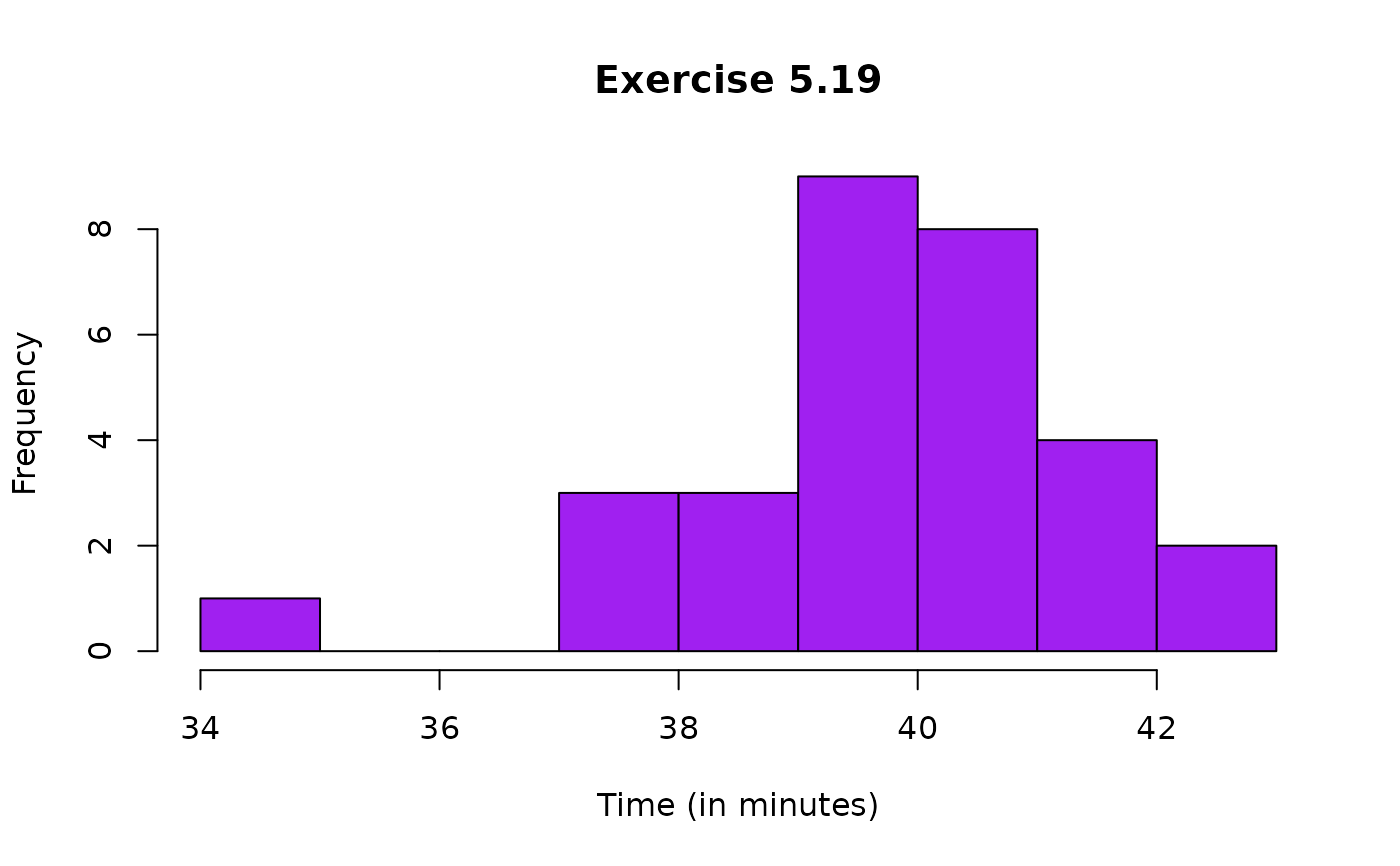
Data for Exercise 5.19
SubwayFormat
A data frame/tibble with 30 observations on one variable
- time
time (in minutes) it takes a subway to travel from the airport to downtown
References
Kitchens, L. J. (2003) Basic Statistics and Data Analysis. Pacific Grove, CA: Brooks/Cole, a division of Thomson Learning.