Data for Exercises 2.16, 2.45, and 2.59
SubmarinFormat
A data frame/tibble with 16 observations on three variables
- month
month
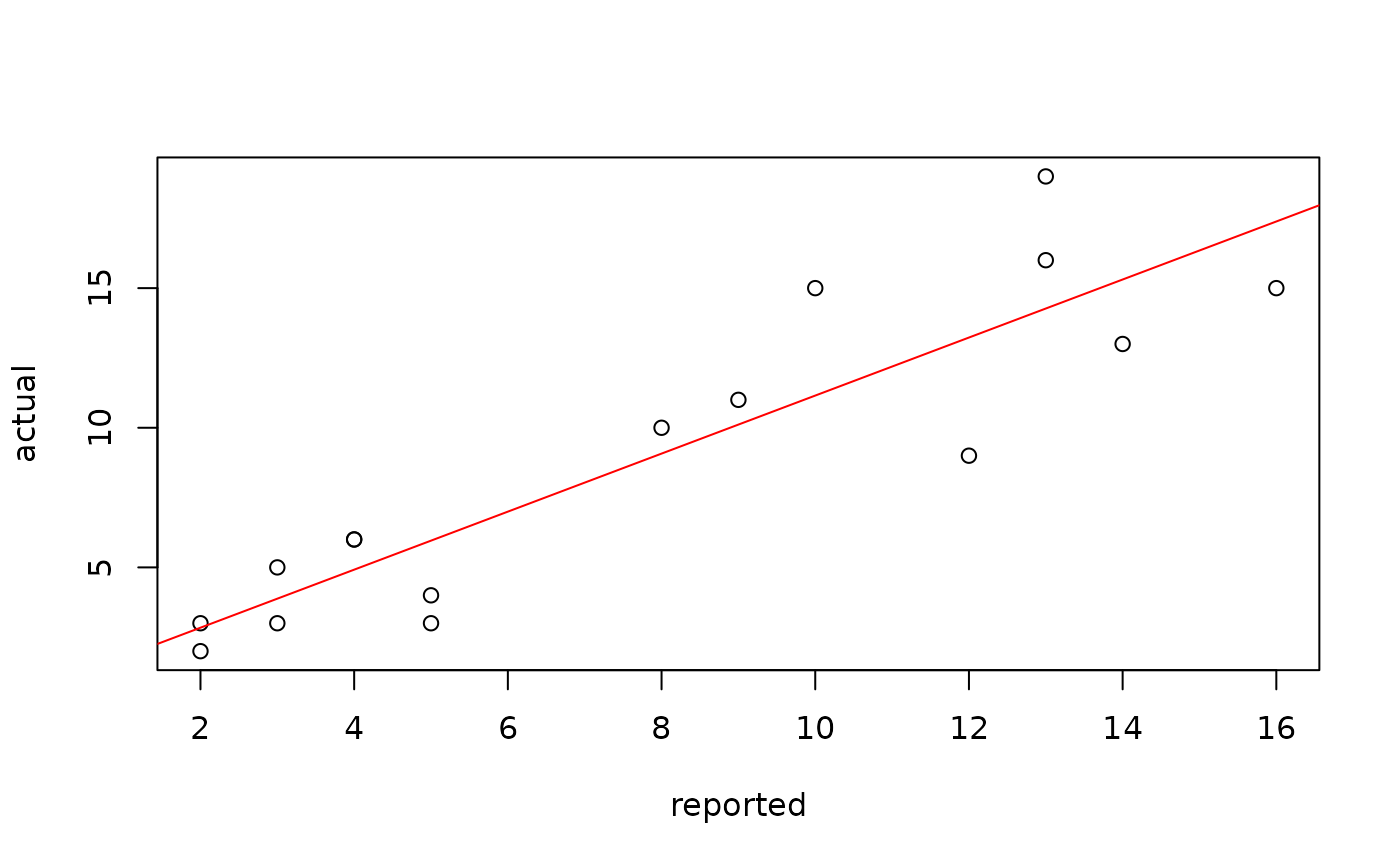
- reported
number of submarines reported sunk by U.S. Navy
- actual
number of submarines actually sunk by U.S. Navy
Source
F. Mosteller, S. Fienberg, and R. Rourke, Beginning Statistics with Data Analysis (Reading, MA: Addison-Wesley, 1983).
References
Kitchens, L. J. (2003) Basic Statistics and Data Analysis. Pacific Grove, CA: Brooks/Cole, a division of Thomson Learning.
Examples
model <- lm(actual ~ reported, data = Submarin)
summary(model)
#>
#> Call:
#> lm(formula = actual ~ reported, data = Submarin)
#>
#> Residuals:
#>     Min      1Q  Median      3Q     Max
#> -4.2306 -2.0454  0.5228  1.0910  4.7304
#>
#> Coefficients:
#>             Estimate Std. Error t value Pr(>|t|)
#> (Intercept)   0.7628     1.2198   0.625    0.542
#> reported      1.0390     0.1360   7.639 2.33e-06 ***
#> ---
#> Signif. codes:  0 ‘***’ 0.001 ‘**’ 0.01 ‘*’ 0.05 ‘.’ 0.1 ‘ ’ 1
#>
#> Residual standard error: 2.513 on 14 degrees of freedom
#> Multiple R-squared:  0.8065,	Adjusted R-squared:  0.7927
#> F-statistic: 58.36 on 1 and 14 DF,  p-value: 2.333e-06
#>
plot(actual ~ reported, data = Submarin)
abline(model, col = "red")

rm(model)