Data for Exercise 6.79
StepFormat
A data frame/tibble with 12 observations on one variable
- score
State test of educational progress (STEP) science test score
References
Kitchens, L. J. (2003) Basic Statistics and Data Analysis. Pacific Grove, CA: Brooks/Cole, a division of Thomson Learning.
Examples
EDA(Step$score)
#> [1] "Step$score"
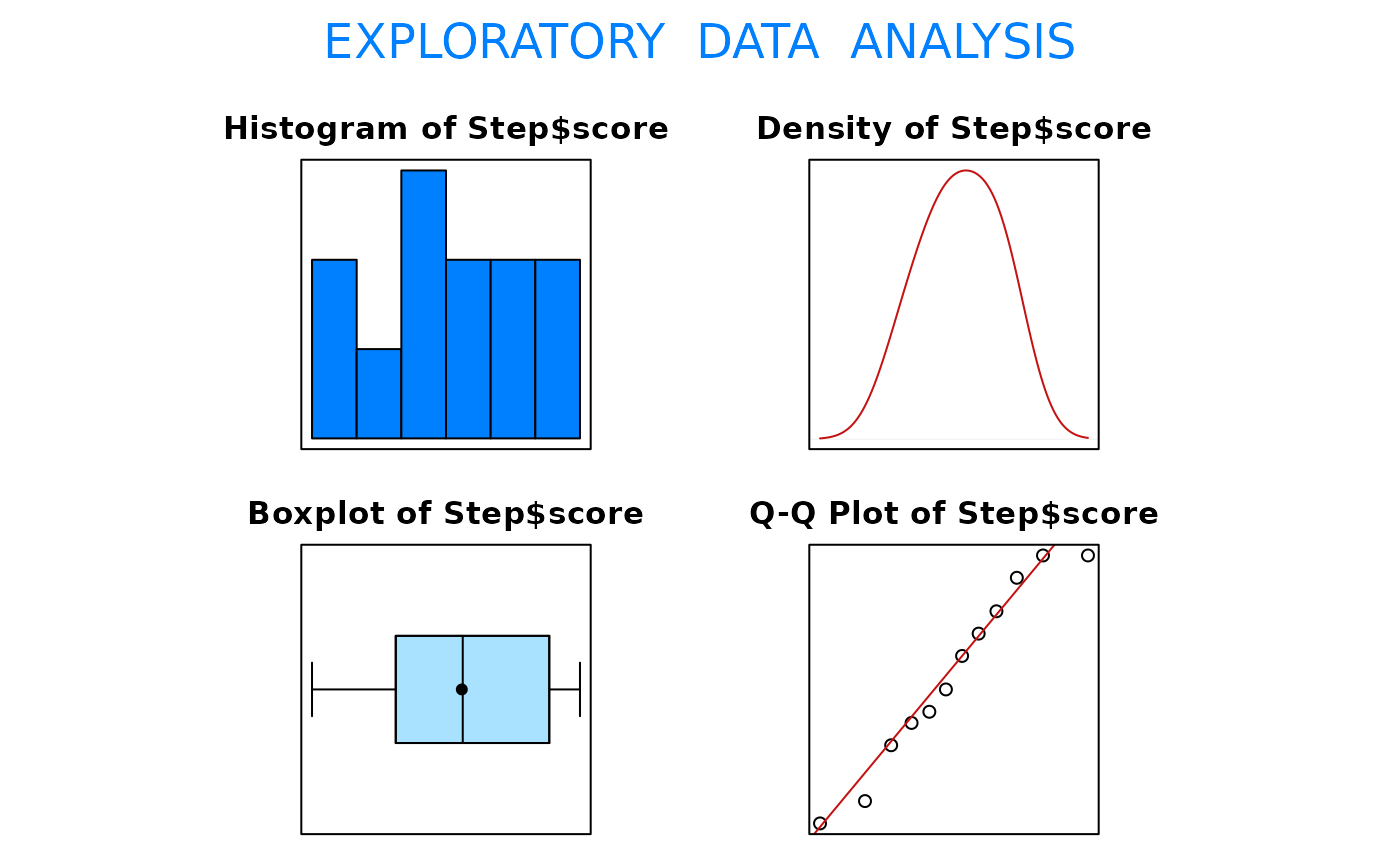 #> Size (n) Missing Minimum 1st Qu Mean Median TrMean 3rd Qu
#> 12.000 0.000 58.000 65.500 71.417 71.500 71.417 79.250
#> Max. Stdev. Var. SE Mean I.Q.R. Range Kurtosis Skewness
#> 82.000 8.140 66.265 2.350 13.750 24.000 -1.420 -0.165
#> SW p-val
#> 0.621
t.test(Step$score, mu = 80, alternative = "less")
#>
#> One Sample t-test
#>
#> data: Step$score
#> t = -3.6526, df = 11, p-value = 0.001902
#> alternative hypothesis: true mean is less than 80
#> 95 percent confidence interval:
#> -Inf 75.63684
#> sample estimates:
#> mean of x
#> 71.41667
#>
wilcox.test(Step$score, mu = 80, alternative = "less")
#> Warning: cannot compute exact p-value with ties
#> Warning: cannot compute exact p-value with zeroes
#>
#> Wilcoxon signed rank test with continuity correction
#>
#> data: Step$score
#> V = 3, p-value = 0.004343
#> alternative hypothesis: true location is less than 80
#>
#> Size (n) Missing Minimum 1st Qu Mean Median TrMean 3rd Qu
#> 12.000 0.000 58.000 65.500 71.417 71.500 71.417 79.250
#> Max. Stdev. Var. SE Mean I.Q.R. Range Kurtosis Skewness
#> 82.000 8.140 66.265 2.350 13.750 24.000 -1.420 -0.165
#> SW p-val
#> 0.621
t.test(Step$score, mu = 80, alternative = "less")
#>
#> One Sample t-test
#>
#> data: Step$score
#> t = -3.6526, df = 11, p-value = 0.001902
#> alternative hypothesis: true mean is less than 80
#> 95 percent confidence interval:
#> -Inf 75.63684
#> sample estimates:
#> mean of x
#> 71.41667
#>
wilcox.test(Step$score, mu = 80, alternative = "less")
#> Warning: cannot compute exact p-value with ties
#> Warning: cannot compute exact p-value with zeroes
#>
#> Wilcoxon signed rank test with continuity correction
#>
#> data: Step$score
#> V = 3, p-value = 0.004343
#> alternative hypothesis: true location is less than 80
#>