Data for Exercises 1.70 and 1.87
StatistiFormat
A data frame/tibble with 62 observations on two variables
- class
character variable with values
Class1andClass2- score
test score for an introductory statistics test
References
Kitchens, L. J. (2003) Basic Statistics and Data Analysis. Pacific Grove, CA: Brooks/Cole, a division of Thomson Learning.
Examples
boxplot(score ~ class, data = Statisti, col = "violet")
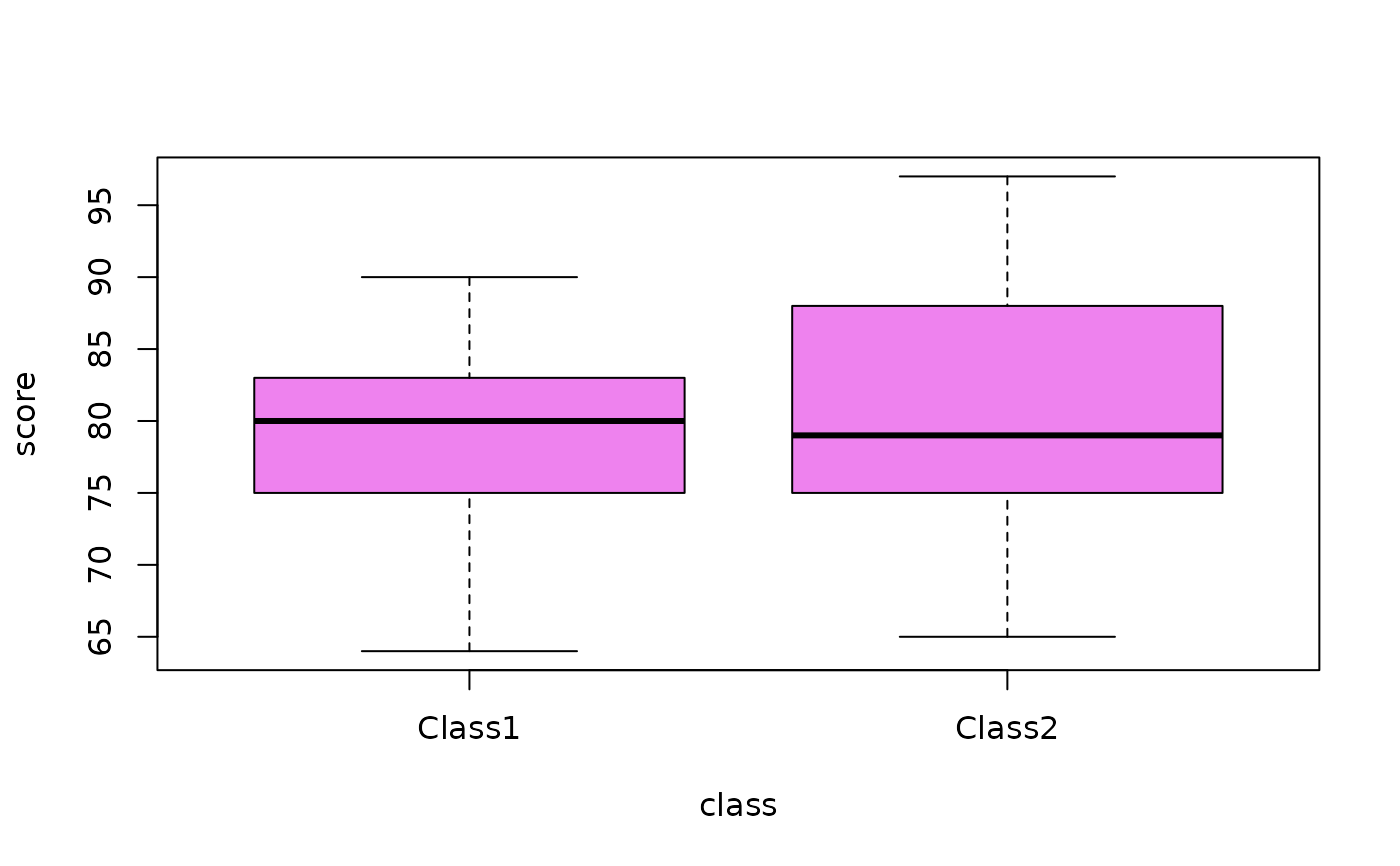 tapply(Statisti$score, Statisti$class, summary, na.rm = TRUE)
#> $Class1
#> Min. 1st Qu. Median Mean 3rd Qu. Max.
#> 64.00 75.00 80.00 78.58 83.00 90.00
#>
#> $Class2
#> Min. 1st Qu. Median Mean 3rd Qu. Max. NA's
#> 65.00 75.00 79.00 80.81 88.00 97.00 4
#>
if (FALSE) {
library(dplyr)
dplyr::group_by(Statisti, class) %>%
summarize(Mean = mean(score, na.rm = TRUE),
Median = median(score, na.rm = TRUE),
SD = sd(score, na.rm = TRUE),
RS = IQR(score, na.rm = TRUE))
}
tapply(Statisti$score, Statisti$class, summary, na.rm = TRUE)
#> $Class1
#> Min. 1st Qu. Median Mean 3rd Qu. Max.
#> 64.00 75.00 80.00 78.58 83.00 90.00
#>
#> $Class2
#> Min. 1st Qu. Median Mean 3rd Qu. Max. NA's
#> 65.00 75.00 79.00 80.81 88.00 97.00 4
#>
if (FALSE) {
library(dplyr)
dplyr::group_by(Statisti, class) %>%
summarize(Mean = mean(score, na.rm = TRUE),
Median = median(score, na.rm = TRUE),
SD = sd(score, na.rm = TRUE),
RS = IQR(score, na.rm = TRUE))
}