Data for Exercise 7.30
StatclasFormat
A data frame/tibble with 72 observations on two variables
- class
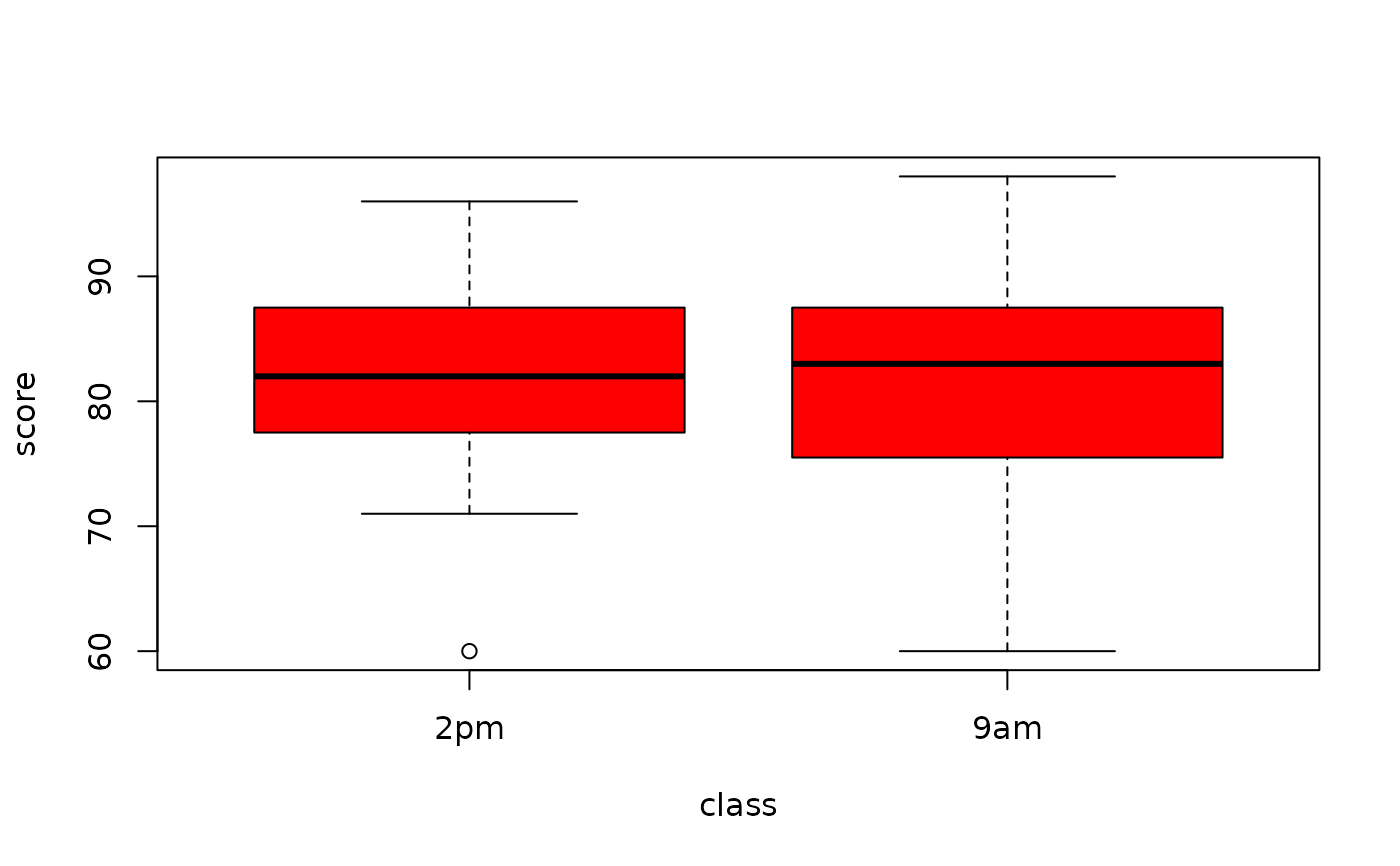
class meeting time (9am or 2pm)
- score
grade for an introductory statistics class
References
Kitchens, L. J. (2003) Basic Statistics and Data Analysis. Pacific Grove, CA: Brooks/Cole, a division of Thomson Learning.
Examples
str(Statclas)
#> tibble [72 × 2] (S3: tbl_df/tbl/data.frame)
#>  $ class: chr [1:72] "9am" "9am" "9am" "9am" ...
#>  $ score: int [1:72] 60 66 66 66 67 67 68 72 74 77 ...
boxplot(score ~ class, data = Statclas, col = "red")

t.test(score ~ class, data = Statclas)
#>
#> 	Welch Two Sample t-test
#>
#> data:  score by class
#> t = 0.73184, df = 64.571, p-value = 0.4669
#> alternative hypothesis: true difference in means between group 2pm and group 9am is not equal to 0
#> 95 percent confidence interval:
#>  -2.593904  5.593904
#> sample estimates:
#> mean in group 2pm mean in group 9am
#>              82.5              81.0
#>
t.test(score ~ class, data = Statclas)
#>
#> Welch Two Sample t-test
#>
#> data: score by class
#> t = 0.73184, df = 64.571, p-value = 0.4669
#> alternative hypothesis: true difference in means between group 2pm and group 9am is not equal to 0
#> 95 percent confidence interval:
#> -2.593904 5.593904
#> sample estimates:
#> mean in group 2pm mean in group 9am
#> 82.5 81.0
#>