Water pH levels of 75 water samples taken in the Great Smoky Mountains
Source:R/BSDA-package.R
Smokyph.RdData for Exercises 6.40, 6.59, 7.10, and 7.35
SmokyphFormat
A data frame/tibble with 75 observations on three variables
- waterph
water sample pH level
- code
charater variable with values
low(elevation below 0.6 miles), andhigh(elevation above 0.6 miles)- elev
elevation in miles
Source
Schmoyer, R. L. (1994), Permutation Tests for Correlation in Regression Errors, Journal of the American Statistical Association, 89, 1507-1516.
References
Kitchens, L. J. (2003) Basic Statistics and Data Analysis. Pacific Grove, CA: Brooks/Cole, a division of Thomson Learning.
Examples
summary(Smokyph$waterph)
#> Min. 1st Qu. Median Mean 3rd Qu. Max.
#> 6.380 6.880 7.030 7.140 7.235 8.430
tapply(Smokyph$waterph, Smokyph$code, mean)
#> high low
#> 7.039697 7.218095
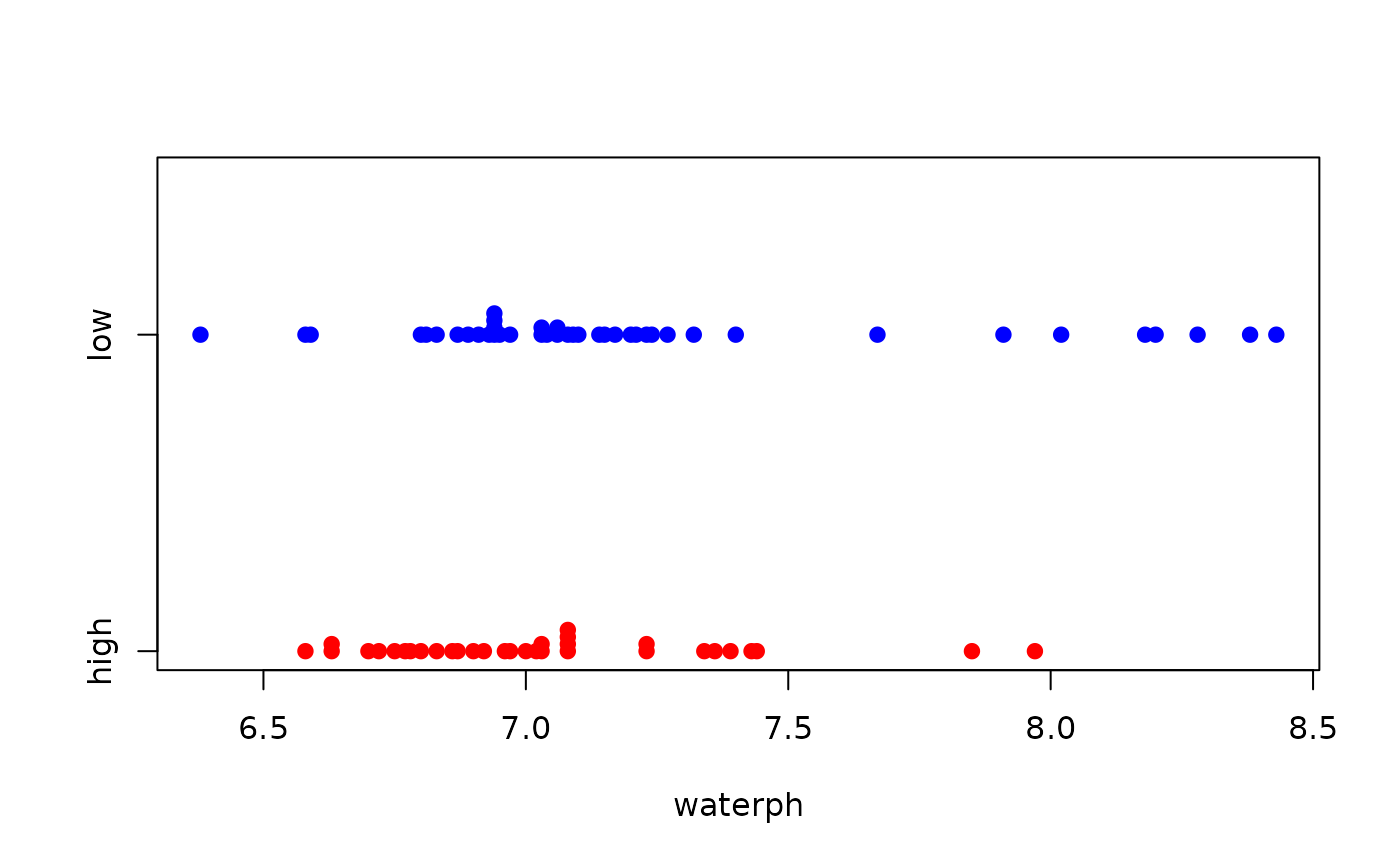
stripchart(waterph ~ code, data = Smokyph, method = "stack",
pch = 19, col = c("red", "blue"))
 t.test(Smokyph$waterph, mu = 7)
#>
#> One Sample t-test
#>
#> data: Smokyph$waterph
#> t = 2.7516, df = 74, p-value = 0.007452
#> alternative hypothesis: true mean is not equal to 7
#> 95 percent confidence interval:
#> 7.038511 7.240689
#> sample estimates:
#> mean of x
#> 7.1396
#>
SIGN.test(Smokyph$waterph, md = 7)
#>
#> One-sample Sign-Test
#>
#> data: Smokyph$waterph
#> s = 42, p-value = 0.2954
#> alternative hypothesis: true median is not equal to 7
#> 95 percent confidence interval:
#> 6.954832 7.085168
#> sample estimates:
#> median of x
#> 7.03
#>
#> Achieved and Interpolated Confidence Intervals:
#>
#> Conf.Level L.E.pt U.E.pt
#> Lower Achieved CI 0.9361 6.9600 7.0800
#> Interpolated CI 0.9500 6.9548 7.0852
#> Upper Achieved CI 0.9630 6.9500 7.0900
#>
t.test(waterph ~ code, data = Smokyph, alternative = "less")
#>
#> Welch Two Sample t-test
#>
#> data: waterph by code
#> t = -1.859, df = 70.875, p-value = 0.03359
#> alternative hypothesis: true difference in means between group high and group low is less than 0
#> 95 percent confidence interval:
#> -Inf -0.01845818
#> sample estimates:
#> mean in group high mean in group low
#> 7.039697 7.218095
#>
t.test(waterph ~ code, data = Smokyph, conf.level = 0.90)
#>
#> Welch Two Sample t-test
#>
#> data: waterph by code
#> t = -1.859, df = 70.875, p-value = 0.06718
#> alternative hypothesis: true difference in means between group high and group low is not equal to 0
#> 90 percent confidence interval:
#> -0.33833836 -0.01845818
#> sample estimates:
#> mean in group high mean in group low
#> 7.039697 7.218095
#>
if (FALSE) {
library(ggplot2)
ggplot2::ggplot(data = Smokyph, aes(x = waterph, fill = code)) +
geom_dotplot() +
facet_grid(code ~ .) +
guides(fill = FALSE)
}
t.test(Smokyph$waterph, mu = 7)
#>
#> One Sample t-test
#>
#> data: Smokyph$waterph
#> t = 2.7516, df = 74, p-value = 0.007452
#> alternative hypothesis: true mean is not equal to 7
#> 95 percent confidence interval:
#> 7.038511 7.240689
#> sample estimates:
#> mean of x
#> 7.1396
#>
SIGN.test(Smokyph$waterph, md = 7)
#>
#> One-sample Sign-Test
#>
#> data: Smokyph$waterph
#> s = 42, p-value = 0.2954
#> alternative hypothesis: true median is not equal to 7
#> 95 percent confidence interval:
#> 6.954832 7.085168
#> sample estimates:
#> median of x
#> 7.03
#>
#> Achieved and Interpolated Confidence Intervals:
#>
#> Conf.Level L.E.pt U.E.pt
#> Lower Achieved CI 0.9361 6.9600 7.0800
#> Interpolated CI 0.9500 6.9548 7.0852
#> Upper Achieved CI 0.9630 6.9500 7.0900
#>
t.test(waterph ~ code, data = Smokyph, alternative = "less")
#>
#> Welch Two Sample t-test
#>
#> data: waterph by code
#> t = -1.859, df = 70.875, p-value = 0.03359
#> alternative hypothesis: true difference in means between group high and group low is less than 0
#> 95 percent confidence interval:
#> -Inf -0.01845818
#> sample estimates:
#> mean in group high mean in group low
#> 7.039697 7.218095
#>
t.test(waterph ~ code, data = Smokyph, conf.level = 0.90)
#>
#> Welch Two Sample t-test
#>
#> data: waterph by code
#> t = -1.859, df = 70.875, p-value = 0.06718
#> alternative hypothesis: true difference in means between group high and group low is not equal to 0
#> 90 percent confidence interval:
#> -0.33833836 -0.01845818
#> sample estimates:
#> mean in group high mean in group low
#> 7.039697 7.218095
#>
if (FALSE) {
library(ggplot2)
ggplot2::ggplot(data = Smokyph, aes(x = waterph, fill = code)) +
geom_dotplot() +
facet_grid(code ~ .) +
guides(fill = FALSE)
}