Sodium-lithium countertransport activity on 190 individuals from six large English kindred
Source:R/BSDA-package.R
Slc.RdData for Exercise 5.116
SlcFormat
A data frame/tibble with 190 observations on one variable
- slc
Red blood cell sodium-lithium countertransport
Source
Roeder, K., (1994), "A Graphical Technique for Determining the Number of Components in a Mixture of Normals," Journal of the American Statistical Association, 89, 497-495.
References
Kitchens, L. J. (2003) Basic Statistics and Data Analysis. Pacific Grove, CA: Brooks/Cole, a division of Thomson Learning.
Examples
EDA(Slc$slc)
#> [1] "Slc$slc"
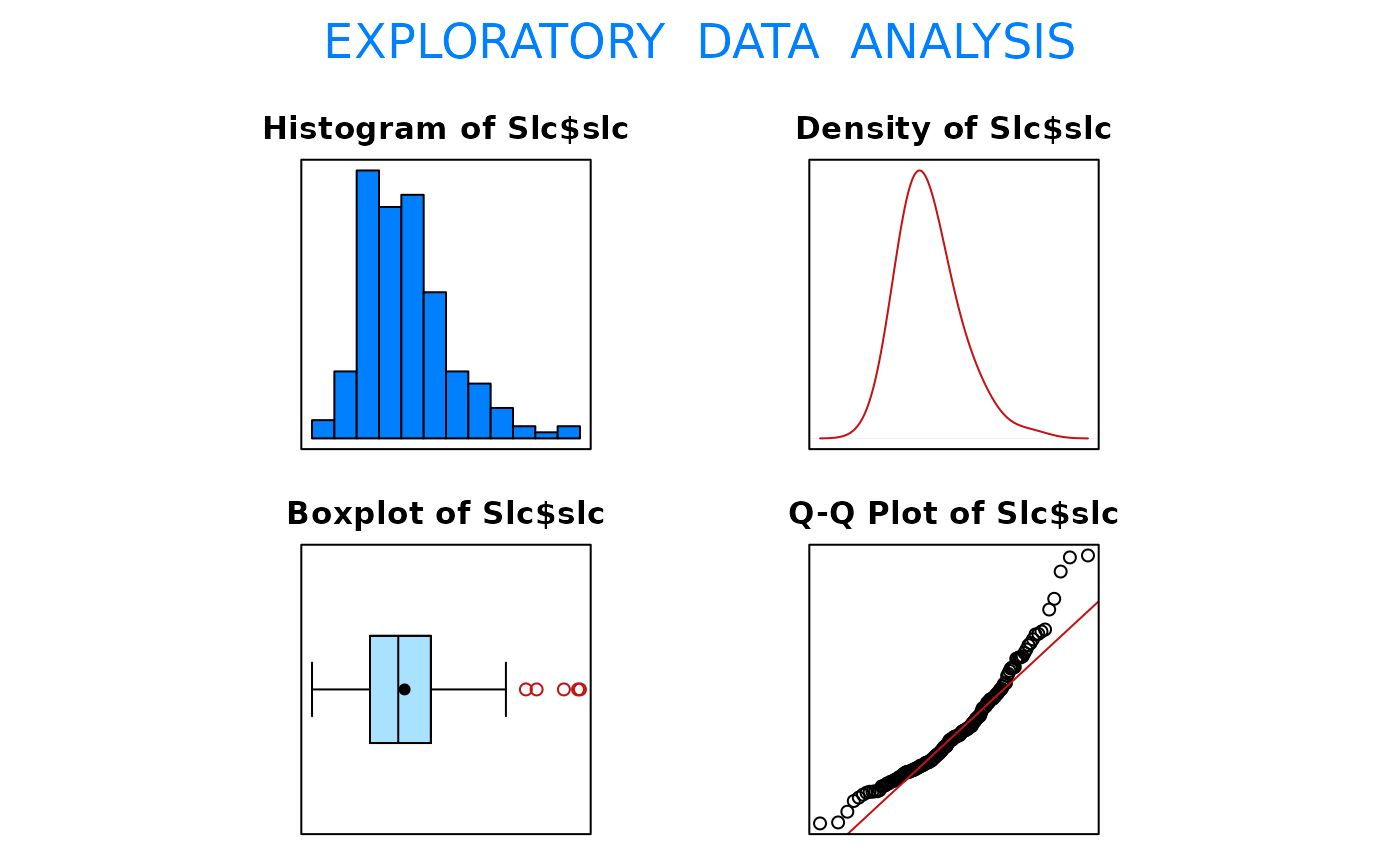 #> Size (n) Missing Minimum 1st Qu Mean Median TrMean 3rd Qu
#> 190.000 0.000 0.073 0.192 0.263 0.250 0.257 0.317
#> Max. Stdev. Var. SE Mean I.Q.R. Range Kurtosis Skewness
#> 0.623 0.099 0.010 0.007 0.125 0.550 1.385 1.050
#> SW p-val
#> 0.000
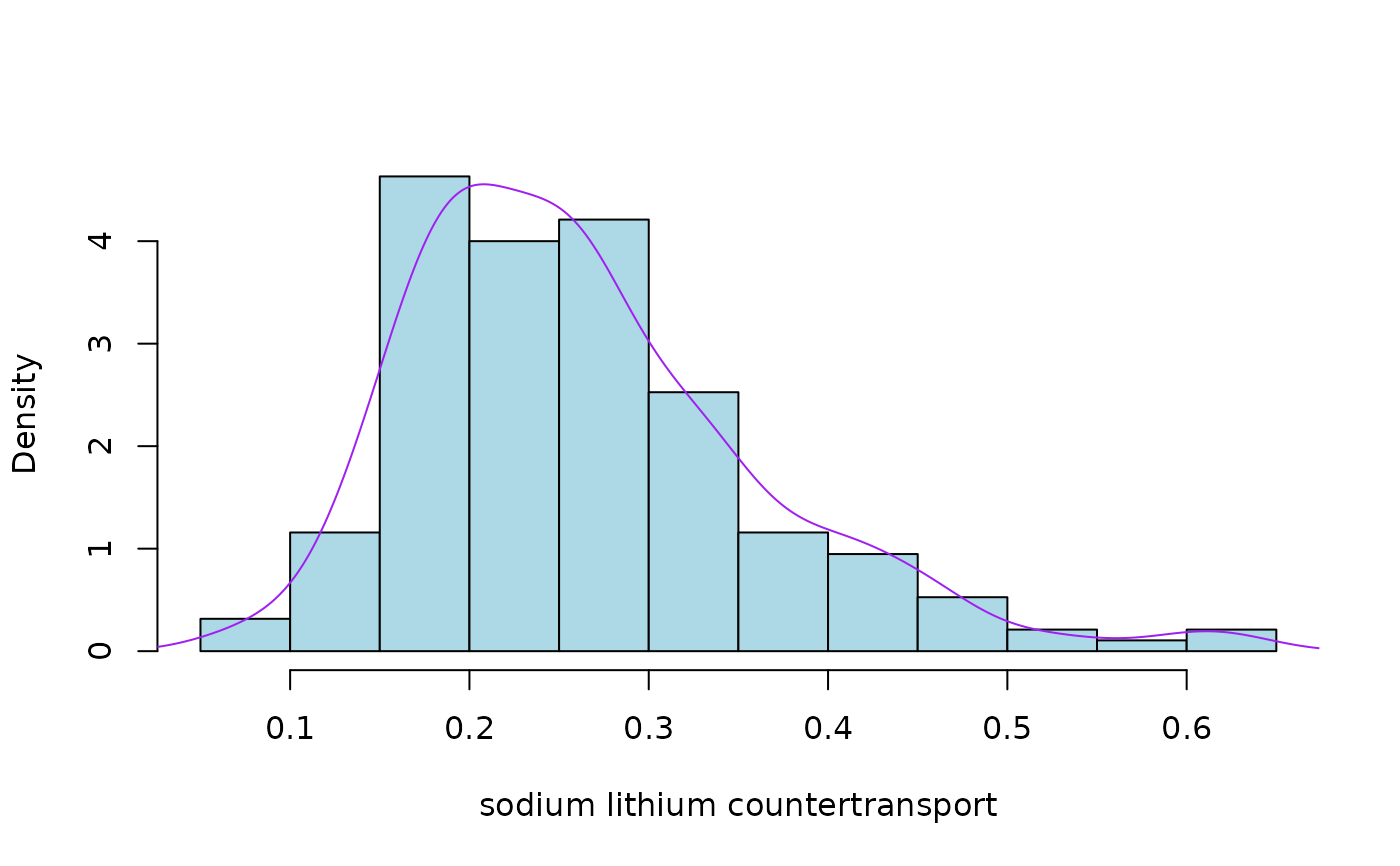
hist(Slc$slc, freq = FALSE, xlab = "sodium lithium countertransport",
main = "", col = "lightblue")
lines(density(Slc$slc), col = "purple")
#> Size (n) Missing Minimum 1st Qu Mean Median TrMean 3rd Qu
#> 190.000 0.000 0.073 0.192 0.263 0.250 0.257 0.317
#> Max. Stdev. Var. SE Mean I.Q.R. Range Kurtosis Skewness
#> 0.623 0.099 0.010 0.007 0.125 0.550 1.385 1.050
#> SW p-val
#> 0.000
hist(Slc$slc, freq = FALSE, xlab = "sodium lithium countertransport",
main = "", col = "lightblue")
lines(density(Slc$slc), col = "purple")