Data for Exercise 7.65
SkewedFormat
A data frame/tibble with 21 observations on two variables
- C1
values from a sample of size 16 from a particular population
- C2
values from a sample of size 14 from a particular population
References
Kitchens, L. J. (2003) Basic Statistics and Data Analysis. Pacific Grove, CA: Brooks/Cole, a division of Thomson Learning.
Examples
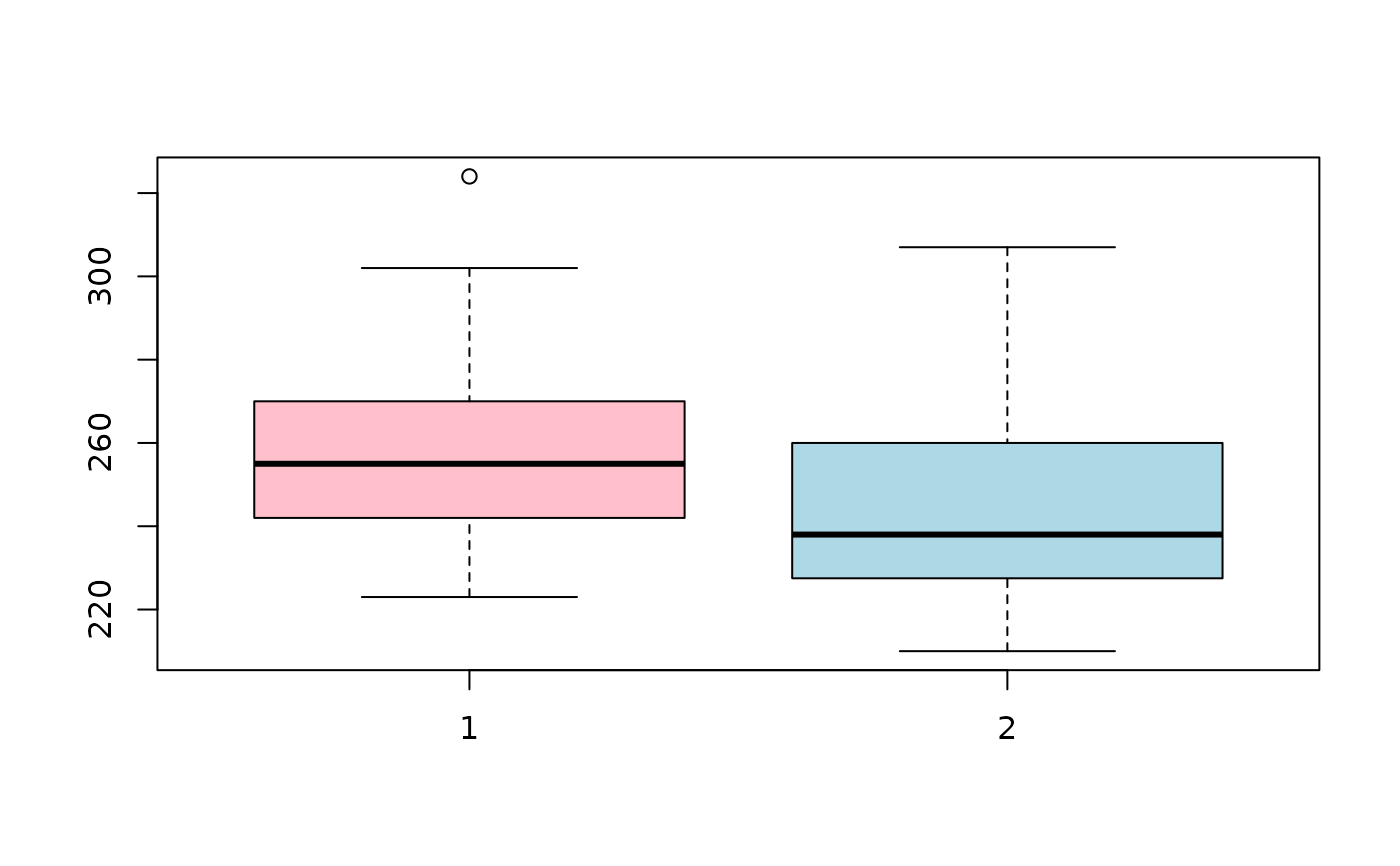
boxplot(Skewed$C1, Skewed$C2, col = c("pink", "lightblue"))

wilcox.test(Skewed$C1, Skewed$C2)
#> Warning: cannot compute exact p-value with ties
#>
#> 	Wilcoxon rank sum test with continuity correction
#>
#> data:  Skewed$C1 and Skewed$C2
#> W = 266.5, p-value = 0.07156
#> alternative hypothesis: true location shift is not equal to 0
#>
wilcox.test(Skewed$C1, Skewed$C2)
#> Warning: cannot compute exact p-value with ties
#>
#> Wilcoxon rank sum test with continuity correction
#>
#> data: Skewed$C1 and Skewed$C2
#> W = 266.5, p-value = 0.07156
#> alternative hypothesis: true location shift is not equal to 0
#>