Data for Exercise 10.50
ShockFormat
A data frame/tibble with 27 observations on two variables
- group
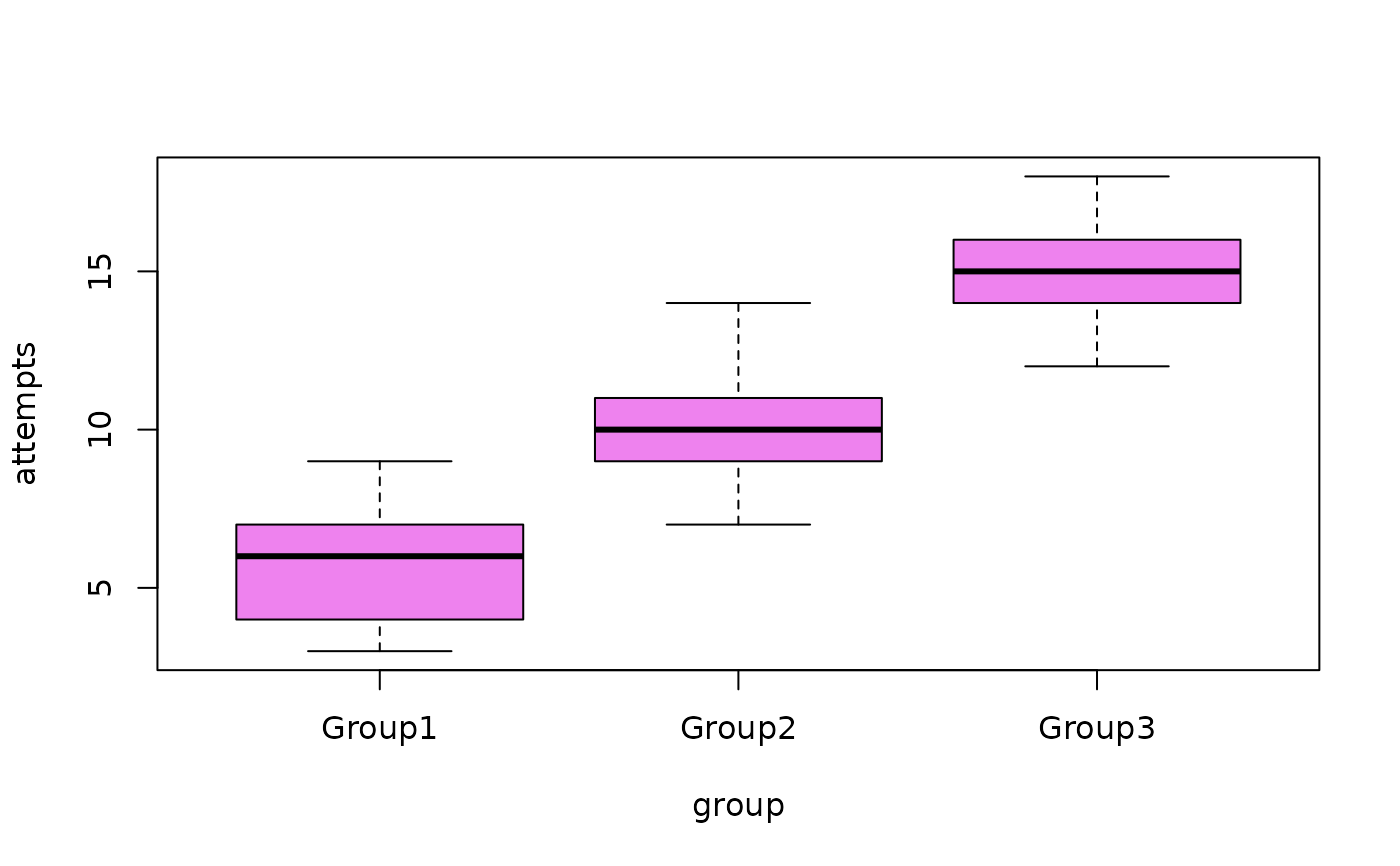
grouping variable with values of
Group1(no shock),Group2(medium shock), andGroup3(severe shock)- attempts
number of attempts to complete a task
References
Kitchens, L. J. (2003) Basic Statistics and Data Analysis. Pacific Grove, CA: Brooks/Cole, a division of Thomson Learning.
Examples
boxplot(attempts ~ group, data = Shock, col = "violet")

model <- lm(attempts ~ group, data = Shock)
anova(model)
#> Analysis of Variance Table
#>
#> Response: attempts
#>           Df Sum Sq Mean Sq F value    Pr(>F)
#> group      2 364.52 182.259  44.635 8.188e-09 ***
#> Residuals 24  98.00   4.083
#> ---
#> Signif. codes:  0 ‘***’ 0.001 ‘**’ 0.01 ‘*’ 0.05 ‘.’ 0.1 ‘ ’ 1
rm(model)
model <- lm(attempts ~ group, data = Shock)
anova(model)
#> Analysis of Variance Table
#>
#> Response: attempts
#> Df Sum Sq Mean Sq F value Pr(>F)
#> group 2 364.52 182.259 44.635 8.188e-09 ***
#> Residuals 24 98.00 4.083
#> ---
#> Signif. codes: 0 ‘***’ 0.001 ‘**’ 0.01 ‘*’ 0.05 ‘.’ 0.1 ‘ ’ 1
rm(model)