Surface-water salinity measurements from Whitewater Bay, Florida
Source:R/BSDA-package.R
Salinity.RdData for Exercise 5.27 and 5.64
SalinityFormat
A data frame/tibble with 48 observations on one variable
- salinity
surface-water salinity value
Source
J. Davis, Statistics and Data Analysis in Geology, 2nd ed. (New York: John Wiley, 1986).
References
Kitchens, L. J. (2003) Basic Statistics and Data Analysis. Pacific Grove, CA: Brooks/Cole, a division of Thomson Learning.
Examples
stem(Salinity$salinity)
#>
#> The decimal point is 1 digit(s) to the right of the |
#>
#> 3 | 4
#> 3 | 56679
#> 4 | 00002234
#> 4 | 6666777888999
#> 5 | 00112333
#> 5 | 68899
#> 6 | 000123
#> 6 | 7
#> 7 |
#> 7 | 8
#>
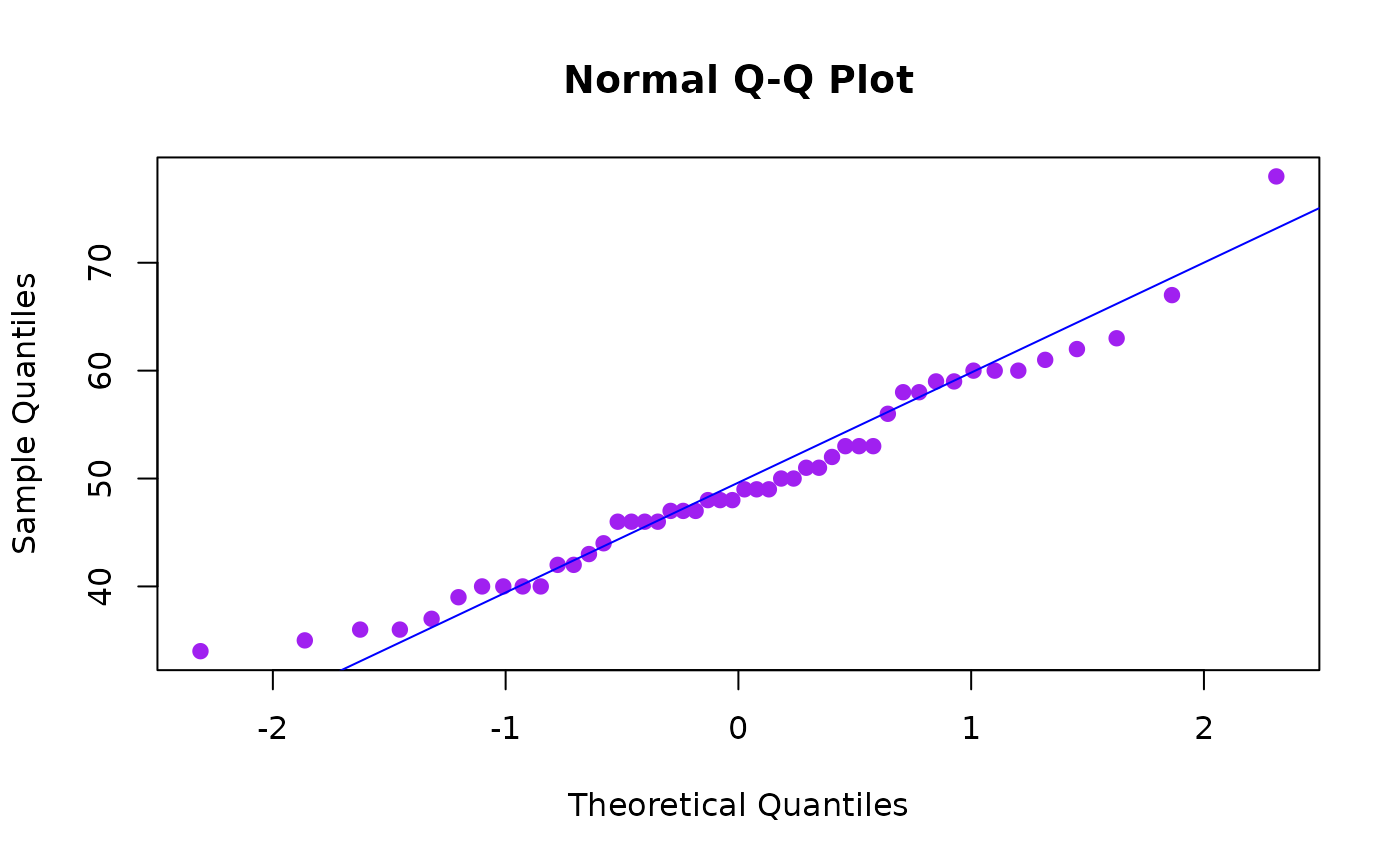
qqnorm(Salinity$salinity, pch = 19, col = "purple")
qqline(Salinity$salinity, col = "blue")
 t.test(Salinity$salinity, conf.level = 0.99)
#>
#> One Sample t-test
#>
#> data: Salinity$salinity
#> t = 37.031, df = 47, p-value < 2.2e-16
#> alternative hypothesis: true mean is not equal to 0
#> 99 percent confidence interval:
#> 45.95012 53.13321
#> sample estimates:
#> mean of x
#> 49.54167
#>
t.test(Salinity$salinity, conf.level = 0.99)$conf
#> [1] 45.95012 53.13321
#> attr(,"conf.level")
#> [1] 0.99
t.test(Salinity$salinity, conf.level = 0.99)
#>
#> One Sample t-test
#>
#> data: Salinity$salinity
#> t = 37.031, df = 47, p-value < 2.2e-16
#> alternative hypothesis: true mean is not equal to 0
#> 99 percent confidence interval:
#> 45.95012 53.13321
#> sample estimates:
#> mean of x
#> 49.54167
#>
t.test(Salinity$salinity, conf.level = 0.99)$conf
#> [1] 45.95012 53.13321
#> attr(,"conf.level")
#> [1] 0.99